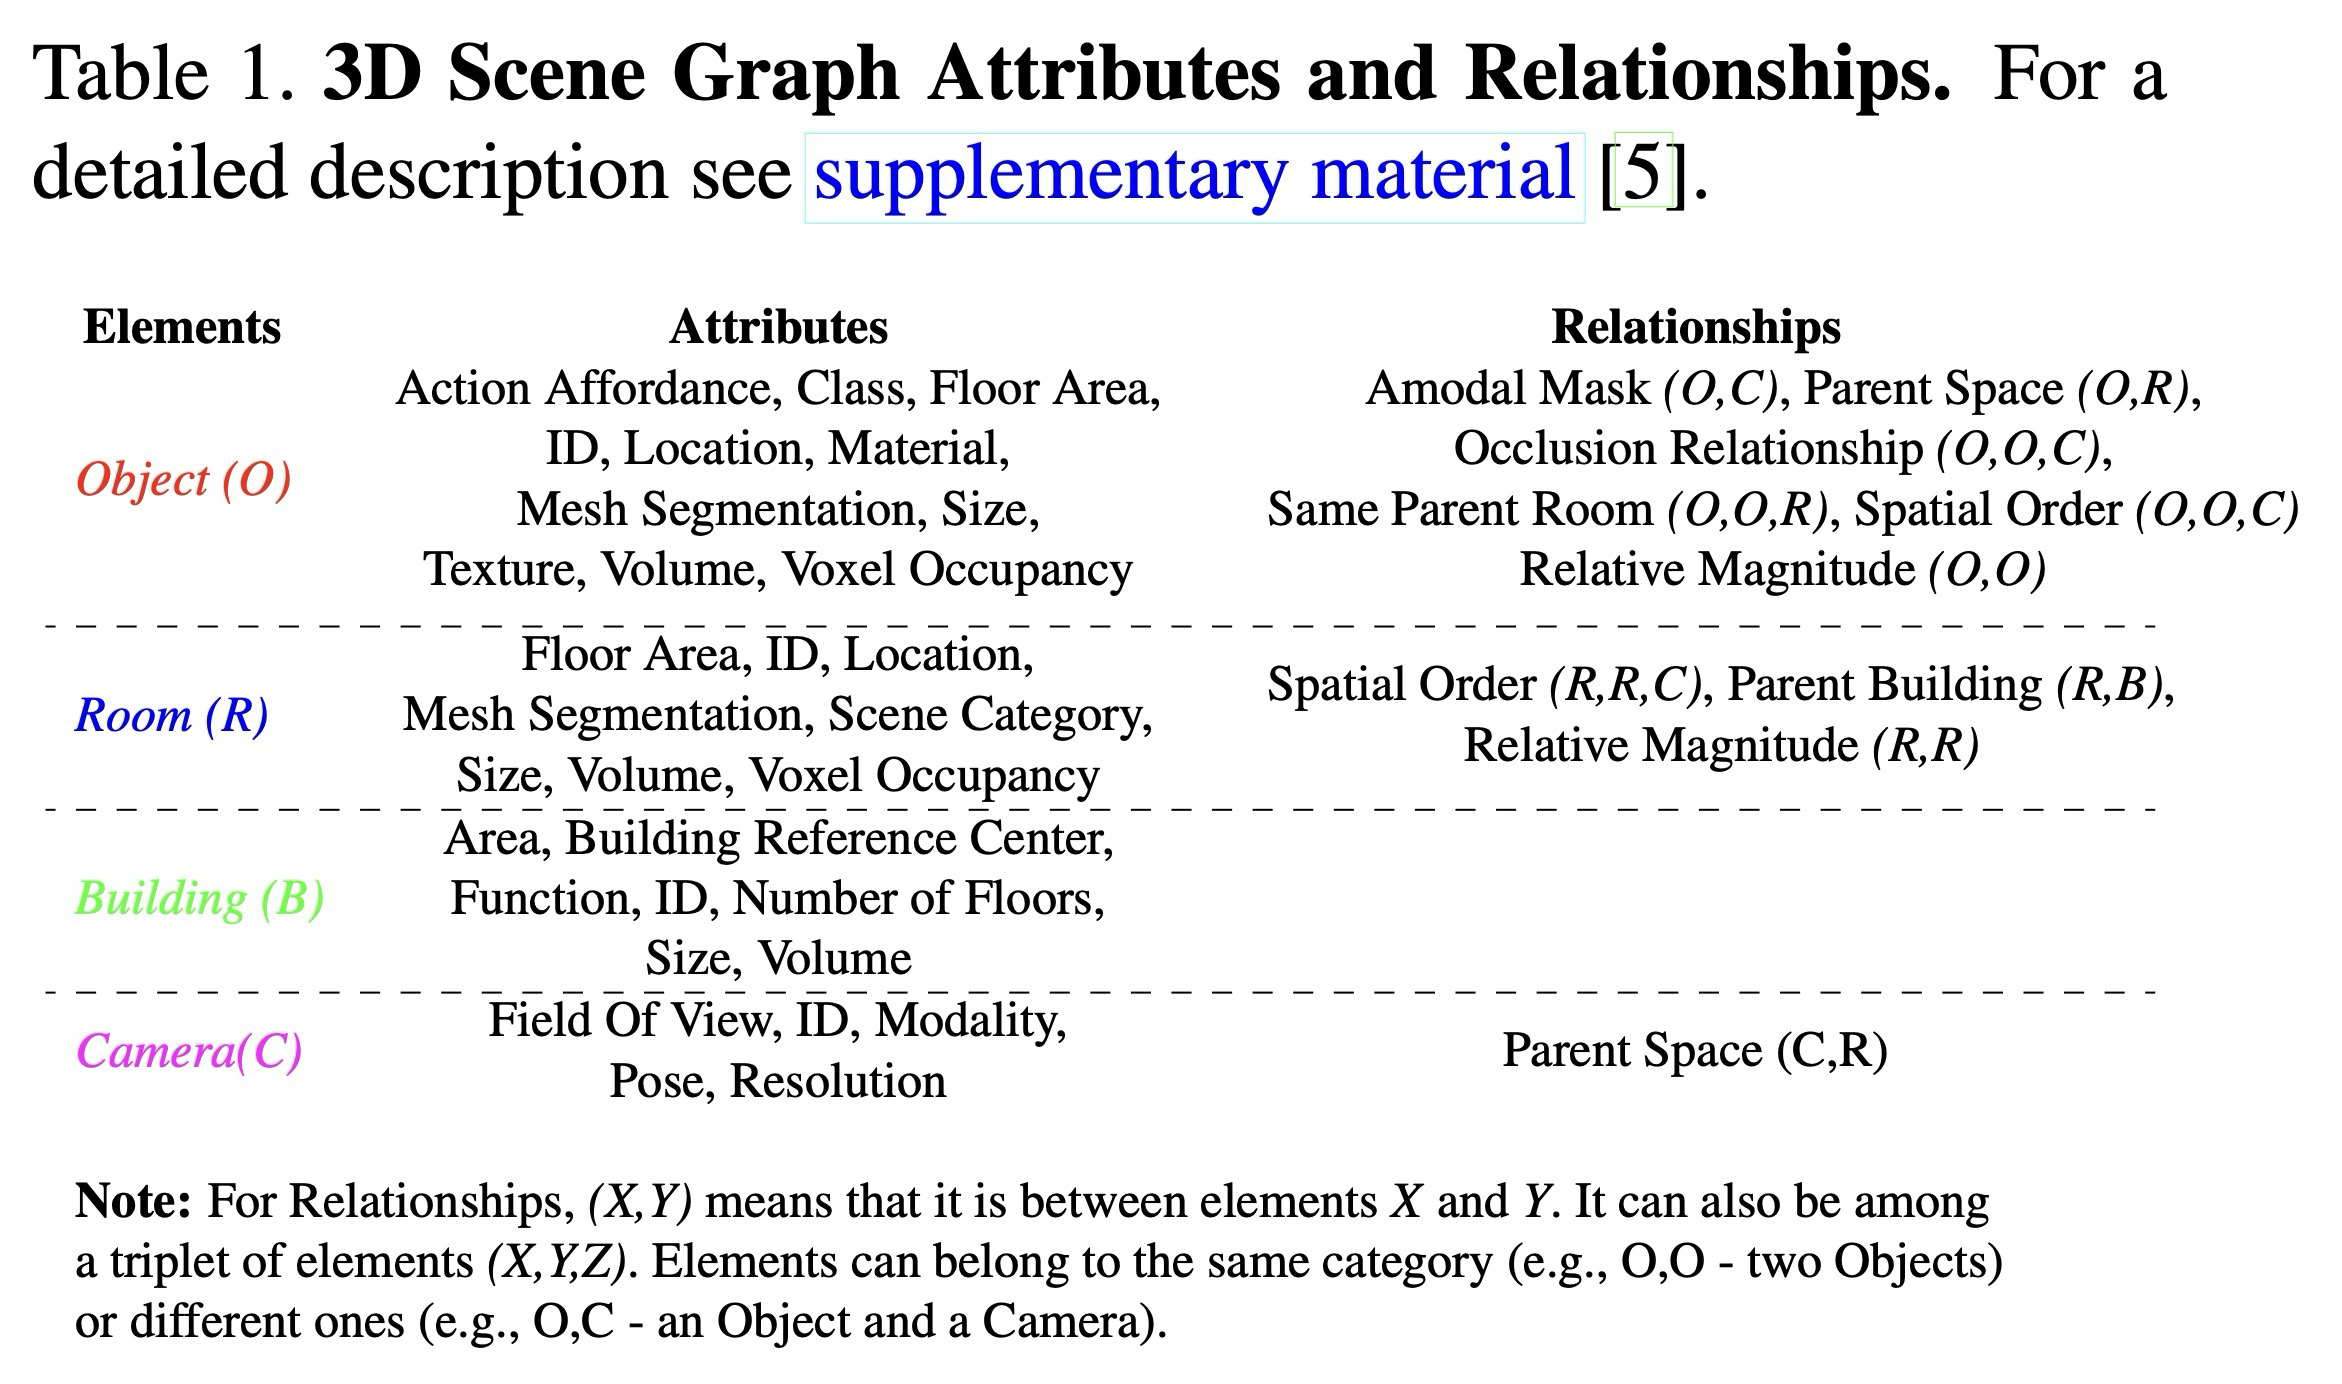
핵심 요약
이 논문은 장면의 의미 정보를 이미지가 아니라 3D mesh에 정합된 scene graph로 저장해, 건물·방·객체·카메라와 그 관계를 하나의 구조에서 다루자는 제안이다.
3D Scene Graph는 3D 공간을 의미 정보의 기준 좌표계로 삼고, 필요할 때 이미지/카메라 관측으로 다시 투영할 수 있는 통합 표현이다.
Unified 3D Representation
building, room, object, camera를 layer graph로 연결하고 각 entity의 attribute/relationship을 함께 저장
2D detector robustification
panorama에서 rectilinear query image를 framing하고 2D detection을 aggregation하여 label 품질 향상
Multi-view consistency
여러 camera 위치의 projection vote를 3D mesh에서 결합해 label leakage와 view별 오류 보정
Gibson graph modality
Gibson Environment에 3D Scene Graph modality를 추가하고 downstream relationship task 가능성 제시
이 논문은 단순히 object detection AP를 올리는 논문이라기보다, 의미 정보를 어디에 저장해야 오래 살아남는가를 묻는 논문에 가깝다. 3D mesh에 의미를 묶어두면 image view가 바뀌어도 같은 object, room, camera 관계를 다시 사용할 수 있다는 관점이 핵심이다.
graph가 어떤 entity layer와 relationship을 묶는지 먼저 확인한다.
같은 semantic 정보가 image, mesh, graph 중 어디에 놓이는지 비교한다.
Image Space
viewpoint, crop, occlusion 변화에 민감. 의미 정보가 관측마다 흔들릴 수 있음
3D Mesh Space
기하와 camera pose가 붙어 있어 view-independent semantic grounding 가능
3D Scene Graph
3D mesh 위 entity, attribute, relationship을 query 가능한 graph로 구조화
3D Scene Graph를 읽을 때 헷갈리기 쉬운 개념을 “무엇을 담는가 / 어떻게 쓰이는가” 기준으로 분리한다.
| 개념 | 담는 정보 | 논문에서의 역할 |
|---|---|---|
Entity | building, room, object, camera 같은 graph node | scene 안에서 query 가능한 단위 |
Attribute | class, material, shape, volume, pose, FOV 등 node별 속성 | 단순 label보다 풍부한 semantic state 제공 |
Relationship | containment, occlusion, spatial order, relative volume 등 edge | object 사이의 비교/관계를 task로 연결 |
Grounding | 2D detection을 3D mesh와 camera pose에 연결 | view가 바뀌어도 semantic 정보 재사용 |
Key Summary
This paper proposes grounding scene semantics not in images, but in a 3D scene graph registered to a mesh, where buildings, rooms, objects, cameras, and their relationships live in one structure.
A 3D Scene Graph uses 3D space as the semantic coordinate system, then projects that information back to image or camera views when needed.
Unified 3D Representation
Organizes building, room, object, and camera entities as a layered graph with attributes and relationships.
2D detector robustification
Frames rectilinear query images from panoramas and aggregates detections to improve label quality.
Multi-view consistency
Combines projection votes from multiple camera locations on the 3D mesh to correct view-specific errors.
Gibson graph modality
Adds 3D Scene Graphs as a public modality for Gibson and demonstrates downstream relationship tasks.
This is less a detector-AP paper and more a representation paper asking where semantic information should live. If semantics are grounded in 3D, the same object-room-camera relationships can survive viewpoint changes and be reused across tasks.
Start by checking which entity layers and relationships the graph connects.
Compare where the same semantic information lives: image, mesh, or graph.
Image Space
Sensitive to viewpoint, crop, and occlusion. Semantics can change with observation.
3D Mesh Space
Geometry and camera pose enable view-independent semantic grounding.
3D Scene Graph
Structures entities, attributes, and relationships on the mesh as a queryable graph.
These terms are easiest to separate by asking what each one stores and how it is used.
| Concept | What it stores | Role in the paper |
|---|---|---|
Entity | Graph nodes such as building, room, object, and camera | Queryable units inside the scene |
Attribute | Node properties such as class, material, shape, volume, pose, and FOV | Provides richer semantic state than a single label |
Relationship | Edges such as containment, occlusion, spatial order, and relative volume | Turns object comparisons into downstream tasks |
Grounding | Links 2D detections to the 3D mesh and camera poses | Lets semantics survive viewpoint changes |
논문 상세 정리
아래부터는 기존 논문 내용을 최대한 담은 상세 해석이다. 핵심 흐름에서 벗어나는 배경지식, notation, 부가 자료는 접어두었다.
Problem: 3D space와 semantics를 왜 묶어야 하나
Abstract는 이 논문을 “검출 알고리즘”보다 “semantic information을 담는 3D 구조”로 읽으라고 안내한다.
| 핵심 질문 | 논문이 택한 답 | 읽는 포인트 |
|---|---|---|
어디에 의미를 저장할까? | 이미지보다 안정적인 3D mesh에 grounding | view가 바뀌어도 유지되는 semantic store |
어떤 구조를 쓸까? | building-room-object-camera를 span하는 layered graph | entity, attribute, relationship을 함께 저장 |
자동화 병목은? | framing과 multi-view consistency로 detector 오류 보정 | 3D graph 구축을 semi-automatic pipeline으로 전환 |
scene에 대한 포괄적인 의미론적 이해(semantic understanding)는 많은 분야(application)에서 중요하게 사용되는데, 다양한 의미론적 정보들이 담길(grounded) 공간은 어떻게 구성해야 하고, 또 어떤 구조를 가져야 할까?
3D Scene Graph는 다양한 의미(semantic)들을 하나의 통합된 구조를 가지며, 3D Mesh와 정합된(registered) panoramic 이미지들이 주어졌을 때, “건물 → 방 → 물체 → 카메라”를 span하는 그래프를 구성하고 내부 요소들에 대한 관계(relationship)도 함께 구성한다.
하지만 해당 작업은 엄청나게 무거운 연산을 필요로 하기 때문에, 본 연구에서는 기존 detection 방법을 활용하고, 2가지의 주요 제약(constraint)을 사용하여 해당 detection 방법의 성능을 향상시킨다.
Abstract에서 말하는 두 제약은 detector를 새로 만드는 것이 아니라, 기존 detector 결과를 2D와 3D에서 각각 안정화하는 장치다.
panorama에서 detector가 보기 쉬운 rectilinear query image를 샘플링하여 2D detection 품질을 올림
여러 camera 위치의 detection을 3D mesh 위에서 모아 label leakage와 view별 오류를 줄임
Context: scene understanding은 왜 흩어지는가
Introduction은 “좋은 semantic representation이 되려면 무엇을 만족해야 하는가”를 먼저 정의한다.
| 후보 공간 | 장점 | 한계 / 논문 해석 |
|---|---|---|
Image | 대부분의 vision task와 직접 연결 | viewpoint, occlusion, crop 변화에 민감 |
3D Mesh | 기하와 camera pose를 안정적으로 보유 | semantic annotation 생성 비용이 큼 |
Scene Graph | object class보다 풍부하고 caption보다 구조적 | 2D graph를 3D space와 결합해야 함 |
논문의 문제의식은 “semantic label을 더 잘 붙이자”가 아니라, semantic label이 오래 유지되고 여러 task로 다시 투영될 수 있는 기준 공간을 만들자는 데 있다.
“어디에 의미론적 정보가 담겨있고, 어떤 구조가 가장 유용하고 불변해야만 하는가?”에 대한 의문은 컴퓨터 비전이나 로보틱스와 같은 다양한 도메인에서 다뤄지는 근본적인 질문이다.
이에 대한 몇 가지 답이 될 수 있는 요소로는 객체나 공간에 대한 기하, 그 속의 요소들의 분류, 장면(scene)이 보여지는 시점 등이 있다.
정보가 담기는 공간()이라 하면, 가장 흔한 선택은 이미지이지만, 파라미터 변화나 객체의 기하 부재 등에 심하게 민감하다는 약점이 있어서 이러한 목적으로 쓰기에는 이상적이지 않다.
논문이 요구하는 “좋은 의미 저장 공간”의 조건은 두 가지로 정리된다.
viewpoint, crop, occlusion, camera parameter 변화에 가능한 한 덜 흔들려야 함
image, video, depth 등 여러 출력 도메인으로 쉽게 다시 연결되어야 함
이를 위해, 본 연구에서는 3D 공간이 더 안정적이고 불변하다는 것을 명확히 하고자 하지만, 이미지와 같은 pixel output domain과 depth와 같은 non-pixel output domain도 연결하여 함께 활용한다. 따라서 3D 공간에 의미론적 정보를 담고, 이를 필요할 때마다 원하는 공간에 투영하여 사용한다.
특히 이는 정보가 건물의 기초적인(underlying) 3D Mesh(메쉬)에 담겨있다는 것을 의미하는데, 내부적으로 자유로운 3D 표현, 가려진 부분을 포함한 객체 추론(amodal) 분석, 가려짐(occlusion) 분석, 빈 공간(open space) 분석 등의 수많은 유용한 정보를 제공한다.
더 중요한 건, 의미들이 이미지와 비디오같은 어떤 시각적 관측으로든 투영될 수 있으며, 이는 annotation과 함께 추가적인 비용없이 제공될 수 있다.
그러면 구조()는 어떨까?
의미 저장소(repositories)는 object class나 natural language caption과 같이 다양하게 표현될 수 있고, scene graph는 이러한 표현 방식들 중에서도 여러 이점을 가지는데, object class 보다 더 많은 정보를 다루고 natural language caption 보다 더 구조적(structure)이고 불변(invariance)성이 있다.
본 연구에서는 Visual Genome에서 기초적인 scene graph 구조를 효율적인 3D 정보와 결합(augment)하여 를 생성한다.
3D Scene Graph는 layered graph로 볼 수 있고, 각 층(level)은 건물, 방, 객체, 카메라 등 다양한 개체(entity)들을 포함하고 있으며, 다른 의미 정보를 표현하기 위해 층을 추가할 수도 있다. 또한 2D Scene Graph와 비슷하게 각 개체는 몇몇 속성(attribute)들과 결합하고, 다른 개체들과 다양한 종류들의 관계(relationship)를 형성한다. 또한 3D Scene Graph를 구성하기 위해 semantic recognition(의미 인식)을 자동으로 수행해주는 SOTA 알고리즘들을 결합한다.
3D Scene Graph는 2D에서 시작해 3D 정보를 점진적으로 모으며 형성된다. 이때 핵심은 아래 두 robustification 제약조건이다.
2D detector가 객체를 더 잘 보도록 panorama에서 query view를 다시 잡음
여러 camera view의 projection을 3D mesh에서 합쳐 semantic output을 일관화
각 제약조건은 보다 강건한 최종 결과 및 일관된(consistent) 의미 출력을 제공한다.
기여는 “표현 구조 → 자동 구축 → 공개 데이터” 순서로 읽으면 흐름이 선명하다.
Scene Graph 개념을 3D 공간에 grounding하여 attribute와 relationship을 함께 활용
불완전한 detector를 framing/MVC로 robustification하여 수작업 병목 완화
Gibson Environment에 3D Scene Graph를 새 semantic modality로 추가·공개
Gap: metric map과 semantic graph 사이에 무엇이 비어 있나
세부 문헌 나열은 접어두고, 이 논문이 어떤 축을 결합하는지 먼저 본다.
| 연구 흐름 | 기존 초점 | 이 논문의 위치 |
|---|---|---|
Scene Graph | 2D image의 object, attribute, relationship | graph 구조를 3D space와 camera까지 확장 |
Semantic DB | class label, mask, material, scene category 등 분절된 repository | Gibson mesh 위에 multimodal semantics를 통합 |
Semi-automatic annotation | 2D/3D annotation을 사람 검수로 보완 | framing+MVC로 자동 결과의 실용성을 먼저 높임 |
Related Work 세부 문헌 흐름 보기
이 토글은 3D Scene Graph가 2D scene graph, 3D semantic mapping, multi-view grounding을 어떻게 이어받는지 확인하는 보충 구간이다.
object와 relation을 graph로 표현하는 semantic 구조를 제공.
object, room, camera pose를 3D 공간 안에 배치하는 방향으로 확장.
retrieval, grounding, question answering처럼 graph가 활용될 수 있는 태스크를 연결.
다양하고 구조화된 저장소로는 Visual Genome이 있는데, 이는 사람과 사물로 이루어진 실제 환경의 2D 이미지들로 이루어져 있다. 각 이미지별 의미 정보가 scene graph 형태로 인코딩되며, 사물의 클래스와 위치는 속성과 관계에 대한 정보를 제공한다.
Scene graph의 노드와 엣지는 수동으로 정의된 자연어 캡션에서 유래하며, 자유형(free form) annotation으로 생기는 이름 불일치를 해결하기 위해 마지막 scene graph로 변환하기 이전에 정규화(canonicalization) 과정을 거친다.
3D Scene Graph는 의미 정보를 자동 생성하여, 효율적이고 표준화 되어 있으며 인간 주관(subjectivity)에서 자유롭다. 사전 정의된 카테고리를 사용하는 것이 제한적일 수는 있으나, 현재 학습 시스템과 호환된다. 게다가 3D Scene Graph는 3D에서 공간적으로 일관된 2D Scene Graph에 대해 무제한으로 연산을 진행할 수 있으며, 관계들을 수식적으로 정확하게 정량화 가능하다. 하지만 현재 연구 환경은 실내 정적 환경에만 한정되어 있어, Visual Genome과 달리 야외 관련 속성이나 행동과 관련된 관계들은 포함하지 않는다.
Visual Genome 이후 scene graph는 아래 네 가지 방향으로 주로 활용되었다.
image에서 object와 relation graph 생성
graph 구조를 설명문 생성의 중간 표현으로 사용
관계 구조를 검색 조건으로 활용
질문 답변에서 object-relation reasoning 지원
Vision-Lauguage task를 제외하고, 관계나 행동 탐지 관련 연구들도 있었다.
3D Scene Graph를 사용하면, 기존 3D 비전 task뿐만 아니라 3D 공간, 2D-2.5D 이미지, 비디오 스트림, 언어를 결합한 새로운 응용 분야도 개발 가능하다.
그래프와 같은 구조를 예측(prediction)에 활용하는 것은 여러 작업에서 유용함이 입증되었는데,
예를 들어, 시멘틱 세그멘테이션(Semantic Segmentation)에서 Conditional Random Fields(CRF)는 local prediction을 전역적으로 부드럽고 일관되게 만드는 데 사용된다.
로봇 네비게이션(robot navigation)에서는 의미 그래프를 통해 물리적 지도를 추상화함으로써, 노드 간 관계를 학습하고 공간과 독립적으로 일반화할 수 있다. 또한 인간-객체 상호작용이나 시공간(spatio-temporal) 문제에서는 연속 영상 프레임 간 노드 연결을 통해 공간뿐만 아니라 시간까지 포함한 구조를 확장할 수 있다.
장면 구문 분석(holistic scene parsing)에서는 geometry, affordance, appearance를 결합한 문법 기반 구조로, 이미지의 장면과 객체 정보를 계층적(hierarchical) 트리 구조로 캡처하며, 노드는 장면과 객체 구성 요소와 속성을 나타내고 엣지는 분해(decomposition)나 관계를 나타낸다.
본 연구에서도 다양한 의미 정보를 결합한 구조를 사용하며, 건물 규모의 전체적인(global) 3D 관계까지 포착할 수 있고, 층을 나누어 그래프를 정의함으로써, 장면 유형과 객체 속성 간 직접적인 의존성을 제거하였다. Visual Memex는 범주 없이 객체 간 문맥적, 시각적 유사성을 그래프로 인코딩하여 마스크된 영역의 객체 클래스를 예측하고, Zhu et al.은 객체, 속성, 사용 가능성 노드 간 엣지를 연결하여 객체 사용 가능성을 추론하였다.
이러한 사례들은 다양한 의미 정보를 통합 구조로 결합하여 멀티모달 추론을 가능하게 하며, 이는 풍부한 구조화 정보의 가치를 잘 보여준다.
기존의 의미 데이터베이스는 특정 유형의 시각 정보에 편중되어 있으며, 대부분 객체 클래스 레이블과 공간적 위치/범위 정보에 집중되어 있다. 이러한 데이터는 시각적 모달리티와 장면 정보(content scene)에 따라 세분화될 수 있으며, 이 중 일부는 3D Mesh 기반의 멀티모달 데이터를 제공한다. Gibson database는 수백 개의 3D Mesh Model과 정합된(registered) 파노라마 이미지를 포함하며, 2D-3D-S보다 약 35배, Matterport3D보다 약 4.5배 큰 평면도(floorplane)를 제공하지만 현재 의미 annotation은 없다. 그 외의 데이터베이스들은 재질(MINC), 시각/촉각 텍스처(DTD), 장면 카테고리(MIT Places) 등 특정 유형의 의미 정보에 특화되어 있다.
의미 검출(Semantic Detection)은 매우 활발한 연구 분야이지만, 본 논문에서는 자세한 내용은 다루지 않는다. 중요한 점은, 기존 데이터베이스와 마찬가지로 연구들이 제한된 범위의 시맨틱 정보에 집중되어 있다는 것이다. 는 클래스 인식부터 공간 범위 정의까지 다양하다.
최근 대표적인 연구로는 Mask R-CNN이 있으며, RGB 이미지에서 object instance segmentation mask를 제공한다. 유사한 출력 결과를 제공하는 다른 모델로는 Blitz-Net(RGB)과 Frustum PointNet(RGB-D)이 있다. 객체 검출 외에도 새로운 데이터베이스를 구축할 때 Crowd-sourcing Data Annotation이 일반적인 전략으로 사용되며, 대부분의 접근법이 수작업에 의존하지만 일부는 자동화를 도입하여 인간 개입을 최소화하고 더 빠른 처리 속도를 제공한다.
예를 들어, Andriluka et al.은 COCO-Stuff로 학습된 Mask R-CNN을 사용해 초기 Object Instance Segmentation Mask를 생성하고, 이를 사용자가 검증하고 수정하도록 한다.
Polygon-RNN은 사용자가 정의한 bounding-box를 기반으로 객체 윤곽을 제공하는 machine-assisted annotation 도구이다.
위 두 방법 모두 2D 환경에서 object category segmentation mask에 집중한다.
3D Annotation에서는 낮은 수준의 자동화를 활용해 annotation 속도를 높이는데,
예를 들어, ScanNet은 실내 3D 공간에 대한 수동 annotation web-interface를 제공하며, 장면을 graph-cut 기반 over-segmentation으로 나눈 뒤, 사용자가 각 segment를 labeling하여 object instance segmentation을 수행하도록 한다.
유사한 접근법으로 [37]은 over-segment를 기하학적, 외형적(appearance) 단서에 따라 더 큰 영역으로 그룹화하고, 사용자가 이를 편집하여 object semantic annotation을 얻는다. [41]은 2D Annotation에서 얻은 object segmentation mask와 label을 사용해 3D Scene Geometry 구조를 자동 복원한다.
그러나 이러한 자동화가 포함되어 있음에도 불구하고, 정확한 결과를 얻기 위해 여전히 인간 개입에 크게 의존한다.
Mechanism: 3D Scene Graph는 무엇을 저장하나
3D Scene Graph는 4개의 layer와 layer 안팎의 edge로 정의된다.
| Layer | Node / Attribute | Relationship | 읽는 포인트 |
|---|---|---|---|
Building root | function, floor, area, volume | parent reference | 하나의 scanned space를 대표하는 graph root |
Room space | scene category, illumination, size | parent building, relative magnitude | 공간 단위 semantic context |
Object entity | class, material, shape, mesh segment | occlusion, spatial order, relative volume | downstream relationship task의 중심 |
Camera view | pose, FOV, modality, resolution | parent space | 3D semantics를 image observation으로 연결 |
Graph 구성 세부 설명 보기
본 연구에서 입력으로 사용한 데이터는 일반적인 3D 스캐너 출력물로, 3D Mesh model, 정합된 RGB 파노라마, 카메라 파라미터를 포함하며, Matterport3D나 Gibson database와 유사하다. 출력은 스캔된 공간의 3D Scene Graph이며, 이를 4계층(graph) 구조로 구성한다. 각 계층에는 노드 집합이 있고, 각 노드는 속성(attributes)을 가지며, 노드 간 엣지는 관계(relationship)를 나타낸다.
4계층 구조는 “공간 전체 → 방 → 객체 → 관측 위치”로 내려가는 hierarchy다.
전체 건물을 대표하는 root node
건물 안의 방을 고유 node로 표현
방 내부의 object와 mesh segment를 graph entity로 관리
각 camera 위치와 image observation을 3D graph에 연결
Attribute
그래프의 모든 노드(e.g. 건물, 방, 객체, 카메라 등)는 속성을 가지며, 예시로는 객체 클래스, 3D 형태, 재질, 위치/자세(pose) 정보 등이 있다.
Relationship
노드 간 연결(edge)은 관계를 나타내며, 같은 계층 또는 다른 계층 간에도 존재할 수 있다. 예를들어 object-object, camera-object-room 등의 관계가 있다.
Mechanism: framing과 MVC로 graph를 어떻게 만들까
구축 파트는 순차 pipeline이라기보다, 2D detector 결과를 3D graph로 안전하게 올리는 robustification map이다.
| 단계 | 역할 | 핵심 아이디어 | 보정하는 오류 |
|---|---|---|---|
Framing | panorama에서 detector 친화적인 rectilinear view 샘플링 | object를 중앙에 두고 충분한 context 확보 | 경계에 잘린 object miss-detection |
Weighted voting | rectilinear detection을 panorama label로 결합 | confidence와 중심 거리 기반 가중치 | local noisy detection |
Multi-view consistency | 여러 panorama projection을 3D mesh에서 결합 | 가까운 camera 관측에 더 높은 weight | label leakage, registration error |
Graph completion | attribute와 relationship 계산 | analytical computation + 일부 off-the-shelf method | object mask를 graph entity/edge로 변환 |
Framing / MVC 세부 구현 보기
3D Scene Graph를 구축하기 위해서는 그래프를 구성하는 요소(element)들과 속성(attributes), 그리고 관계(relationships)를 식별해야 한다. 그러나 요소의 수가 많고 공간 규모가 크기 때문에, 입력 RGB 이미지와 3D Mesh 데이터에 대해 object label과 segmentation을 annotate하는 과정이 가장 큰 병목이 된다.
이에 본 논문은 기존 의미 검출기를 활용해 Annotation 파이프라인을 자동으로 초기화(bootstrap)하고, 인간의 개입을 최소화하는 자동화 방법을 제안하는 데 초점을 둔다. 전체 파이프라인 개요는 Figure 2에 제시되어 있다.
실험(Section 5)에서는 성능이 가장 우수하다고 보고된 Mask R-CNN을 사용하였으며, 신뢰도(confidence) 0.7 이상의 검출 결과만을 활용하였다. 다만 객체 검출 결과가 완벽하지 않기 때문에, 성능 향상을 위해 과 라는 두 가지 강건화(robustification) 기법을 제안하며, 이는 각각 2D 도메인과 3D 도메인에서 동작한다.
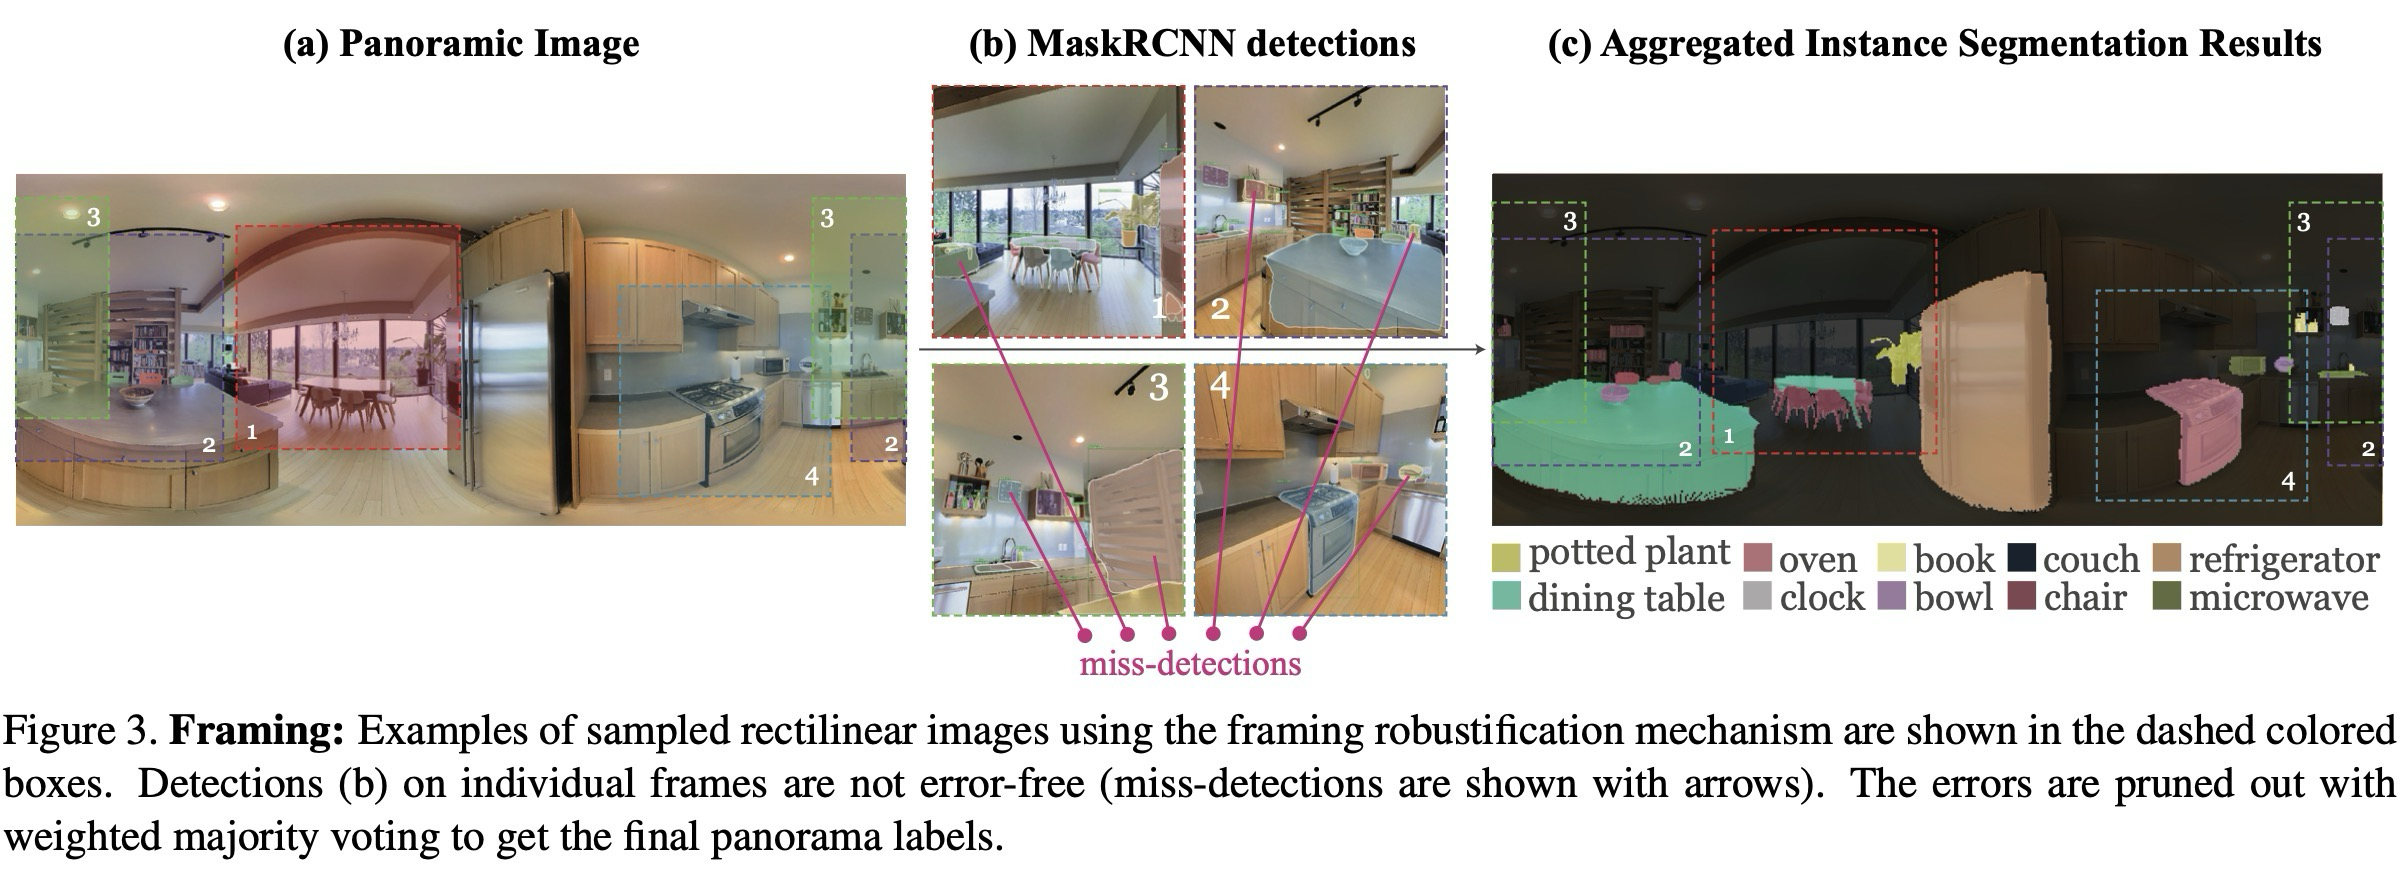
기존의 2D semantic 알고리즘은 직교(rectilinear) 이미지를 입력으로 사용하며, 이미지 경계에 걸쳐 객체가 부분적으로만 포함될 경우 오검출이 자주 발생하는 문제가 있었는데, 동일한 객체라도 시점을 약간 달리해 이미지 중앙에 가깝고 완전하게 포착되게 하면 검출 정확도가 향상되어, RGB 파노라마 이미지를 입력으로 사용할 경우, 이러한 특성을 활용해 검출 정확도를 높이기 위한 framing 기법을 적용할 수 있다.
Framing은 파노라마로부터 여러 개의 직교 이미지를 샘플링하여 객체 검출에 유리한 뷰를 생성하는 것이다. 핵심 heuristic은 아래 두 가지다.
객체가 이미지 중앙에 오도록 view를 잡아 boundary crop을 줄임
객체를 크게 보이게 하되 주변 문맥이 남도록 적절히 확대
이를 위해 파노라마 상에서 서로 다른 yaw(), pitch(), 시야각(FoV)을 가진 직교 이미지를 조밀하게 샘플링하여, 장면 내 각 객체에 대해 최소 하나 이상의 이미지가 아래의 조건을 만족하게 한다.
Framing / voting 세부 설정 보기
framing의 sampling 설정, weighted voting 수식, instance mask 후처리를 확인하는 보충 구간이다.
yaw, pitch, FoV 조합으로 panorama에서 detector-friendly view를 생성.
confidence와 image-center distance를 함께 반영해 pixel class를 통합.
class segmentation을 instance mask로 바꾸는 마지막 후처리.
이 과정으로 파노라마 하나당 800×800 해상도의 직교 이미지 225장을 생성하며, 이를 Mask R-CNN의 입력으로 사용한다. 직교 이미지에서 발생하는 불완전한 검출 결과를 제거하기 위해, 모든 검출 결과를 다시 파노라마 좌표계로 집계(aggregate)하고 가중 투표(weighted voting) 방식을 적용한다. 이때 가중치는 검출 신뢰도 점수(confidence score)와 검출 위치가 이미지 중심에서 얼마나 떨어져 있는지를 함께 고려한다. 구체적으로는 각 클래스에 대해 픽셀 단위 가중치를 계산하여 결과를 통합한다.
위 수식에서 는 파노라마 픽셀 가 클래스 에 속할 가중치이며, 는 직교 이미지 에서 픽셀 에 대응되는 검출 의 클래스를 의미하고, 는 검출 신뢰도 점수, 는 검출 중심 좌표, 는 직교 이미지 의 중심을 의미한다. 이러한 가중치를 기반으로 각 파노라마 픽셀에 대해 가장 높은 점수를 갖는 클래스를 선택한다.
그러나 픽셀 단위로만 집계할 경우, object instance 단위의 정보를 고려하지 못해 국소적(local) 불일치가 발생할 수 있는데, 이를 해결하기 위해 각 직교 이미지의 검출 결과를 기준으로, 그 안에 포함된 파노라마 픽셀들의 최고 점수 클래스들을 후보 집합으로 모은 뒤, 그 중에서 가장 많이 나타나는 클래스를 해당 검출의 최종 라벨로 할당한다.
이 단계까지는 파노라마가 class 단위로만 segmentation 되어 있으며, instance 구분은 이루어지지 않는다. 마지막으로 클래스별 연결 성분(connected components)을 찾음으로써 object instance segmentation mask를 생성한다.
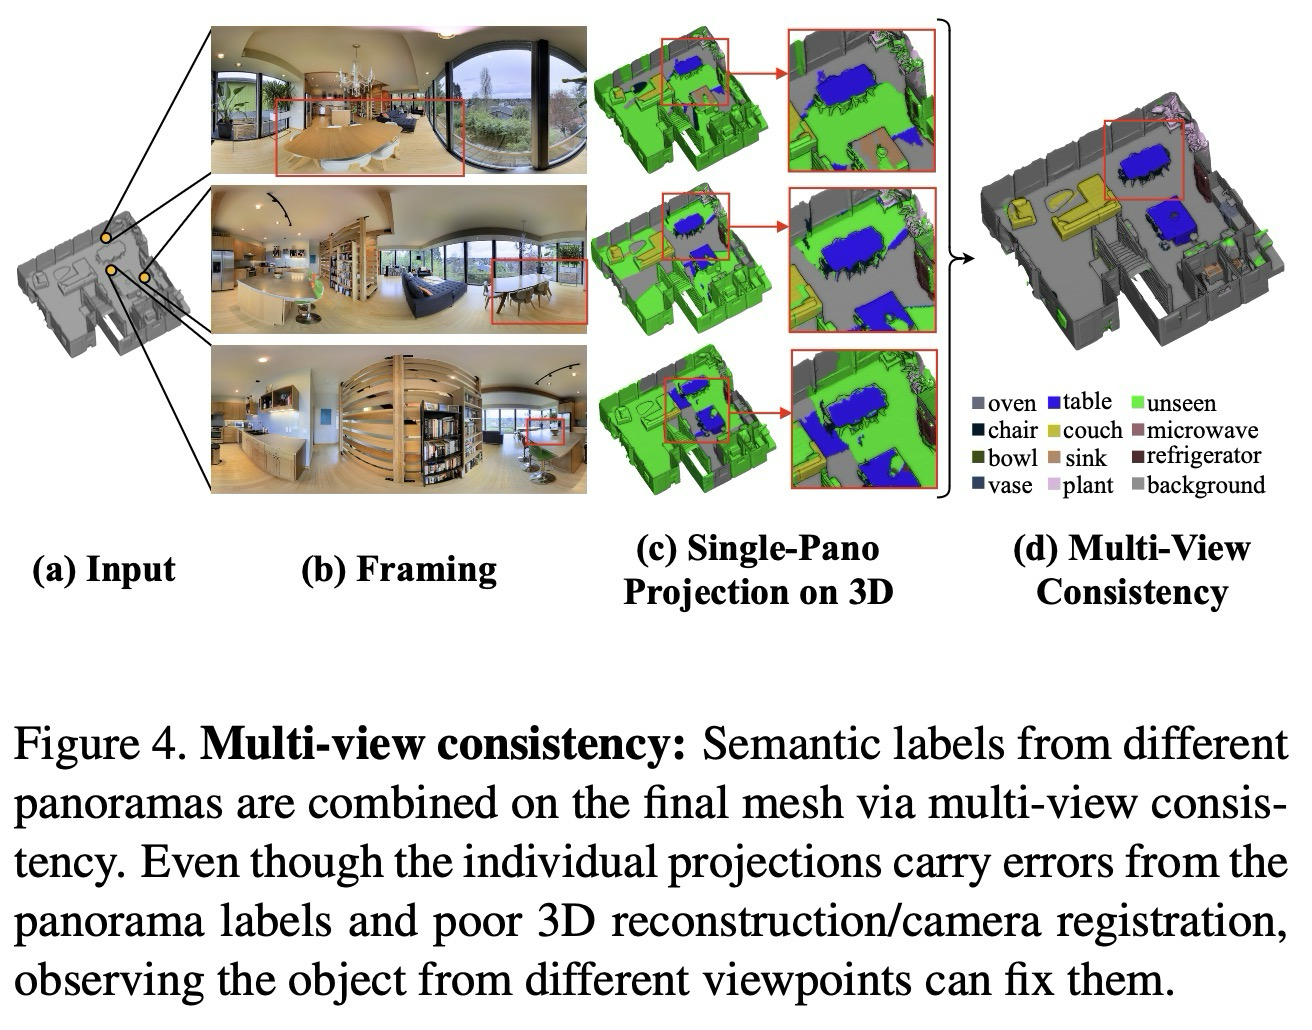
RGB 파노라마를 3D Mesh에 정합하면 2D 픽셀 라벨을 3D 표면에 투영하여 annotation 할 수 있지만, 단일 파노라마만을 투영할 경우 파노라마 불완전성, 특정 객체 재구성 오류, 이미지 픽셀과 메쉬 표면 간 미세한 불일치(카메라 정합 오차) 때문에 라벨이 인접 객체로 “누출(leaking)”될 수 있다. 이러한 문제는 객체가 여러 파노라마에서 관찰 가능하다는 점을 활용해 으로 해결할 수 있으며, 두 번째 강건화 기법으로 제안된다.
먼저 모든 파노라마 레이블을 3D Mesh에 투영한 뒤, 투영된 표면(mesh)에 대해 가중치 다수결 투표를 수행하는데, 관찰 시점(observation point)와 표면(surface) 간 거리가 가까울수록 가중치를 높게 부여하며, 카메라가 물체와 가가울수록 더 크고, 더 잘 보인다는 heuristic을 따른다.
가중치는 구체적으로 아래와 같이 표현한다.
위 수식에서 는 카메라 위치 에 대한 표면 의 가중치를 나타내고, 는 중심을 3차원 좌표계로 나타낸 것이다. framing 메커니즘과 비슷하게, 투표는 검출 단계에서 진행되는데, 파노라마에서 동일한 object instance로부터 투표를 받은 표면들의 집합 에 대해 라벨 일관성을 찾는다.
첫 번째로, 모든 파노라마로부터 투영된 결과를 바탕으로, 의 라벨 후보들을 결정하기 위한 개별 표면에 대해 가중치 다수결 투표를 진행하고, 그 중 가장 빈번하게 나타나는 라벨을 해당 객체 그룹 전체에 할당한다.
마지막으로 3차원 공간에서 연결 성분 분석을 수행하여 최종 instance segmentation mask를 생성하고, 이 결과를 다시 파노라마 이미지에 투영함으로써 2D와 3D에서 서로 일관된 라벨을 얻을 수 있다.
자동 구축 이후의 수동 검증과 관계 계산은 “필수 pipeline”이라기보다 graph 품질을 올리는 후처리로 읽으면 된다.
| 구간 | 입력 | 처리 | 산출 |
|---|---|---|---|
Verification | 자동 추출된 3D mesh label | rectilinear view에서 label/mask 확인, 누락 object 추가 | 검수된 object mask와 label |
Room / Object Attribute | object element, room segmentation | 공개 방법과 analytical computation 결합 | room category, object volume, material 등 |
Relationship | 3D object geometry와 camera pose | ray tracing, convex hull volume, relative spatial comparison | amodal mask, occlusion, spatial order, relative volume |
4. 1. User-in-the-loop verification
마지막 단계로, 자동으로 추출된 결과에 대해 수동 검증(verification)을 수행하며, 이를 위해 사용자가 필요 시 결과를 확인하고 수정할 수 있는 웹 인터페이스를 개발하였다. 이 검증 과정은 Amazon Mechanical Turk(AMT)를 통해 크라우드 소싱 방식으로 진행되었으며, 자동화된 결과만으로도 충분히 실용적인 활용이 가능하기 때문에 전체 파이프라인에서 필수적인 단계로 간주되지는 않는다. 수동 검증은 주로 평가 목적과 오류가 없는 고품질 데이터를 요구하는 일부 연구 활용을 위해 수행된다.
전체 파이프라인은 직교(rectilinear) 이미지 상에서 수행되는 2가지 주요 단계로 구성된다.
첫 번째 단계는 (검증 및 편집)으로, 최종 3D 메쉬 레이블을 파노라마에 투영한 뒤 각 객체가 화면 중앙에 최대한 크게 보이도록 하고, 주변 20%의 문맥을 포함한 직교 이미지를 렌더링한다.
검증 단계에서 사용자가 확인하는 일은 label 확인, mask 품질 검토, 필요 시 mask 수정으로 나뉜다.
객체 class label이 틀리면 해당 이미지를 이후 과정에서 제외
object segmentation mask가 기준을 만족하는지 확인
품질이 부족하면 새로운 segmentation mask를 직접 추가
두 번째 단계는 (누락된 객체 추가)로, 앞선 단계에서 자동화한 결과를 정제하더라도, 여전히 검출되지 않은 객체가 있을 수 있기 때문에 수행된다. 이를 위해 검증된 마스크를 다시 파노라마에 투영한 후, 이를 yaw 방향으로 72도씩 겹치게 나눈 5개의 직교 이미지로 분해한다.
두 번째 수동 단계는 누락 객체를 찾고, 같은 category의 모든 instance가 mask될 때까지 보완하는 과정이다.
특정 object category의 instance가 빠졌는지 확인
해당 category의 모든 object가 mask될 때까지 반복적으로 추가
4. 2. Computation of attributes and relationships
앞서 설명한 방법은 그래프의 객체(object) 요소를 산출하지만, 완전한 3D Scene Graph는 객체 외에도 다양한 요소 유형과 각 요소의 속성, 그리고 요소들 간의 관계를 포함한다. 이를 계산하기 위해 저자들은 기존에 공개된 학습 기반 방법과 분석적 기법을 활용한다.
참고문헌 [7] 방법으로 room 요소를 검출
object volume은 3D convex hull로 계산하고, material은 정확도 한계 때문에 수동 정의
모든 객체 간 관계는 자동 계산으로 도출되며, 예를 들어 특정 카메라 시점에서 객체의 2D 는 3D Mesh에 대해 ray-tracing을 수행하여 계산하고, 두 객체 간 상대적 부피는 각각의 3D convex hall 부피 비율로 산출한다.
이러한 요소와 관계에 대한 전체적인 설명과 결과 영상은 부록 자료[5]에 제시되어 있다.
Evidence: 어떤 query와 task에서 검증했나
Experiments는 “3D Scene Graph가 실제로 자동 구축되고 task에 쓰일 수 있는가”를 여러 evidence로 확인한다.
| 검증 축 | 무엇을 보여주나 | 핵심 결과 |
|---|---|---|
Pipeline accuracy | framing과 MVC가 AP/AR을 얼마나 올리는지 | 2D AP 0.079 → 0.485, 3D AP 0.222 → 0.409 |
Human labor | 자동화가 annotation 비용을 줄이는지 | 완전 자동 AP 0.389, 검수 포함 AP 0.97 |
Detector generality | 다른 detector에도 robustification이 유효한지 | Mask R-CNN과 BlitzNet 모두 상대적 향상 |
Downstream tasks | relationship이 실제 예측 task로 이어지는지 | spatial order, relative volume, amodal mask에서 활용 |
평가 세부 결과 보기
본 섹션에서는 Gibson Environment’s database의 자동화 파이프라인을 평가한다.
5.1. Dataset Statistics
Gibson Environment database는 총 572개의 완전한(full) 건물로 구성되어 있으며, 실제 실내 공간에서 수집된 데이터로 각 건물마다 3D Mesh 모델, RGB 파노라마 이미지, 그리고 카메라 포즈 정보를 제공한다. 저자들은 제안한 자동 파이프라인을 사용해 모든 2D 및 3D 모달리티에 대해 annotation을 수행하고, Gibson database의 tiny split에 대해서만 수동 검증을 진행하였다.
사용된 시맨틱 카테고리는 객체의 경우 COCO dataset, 재질은 MINC, 질감(texture)은 DTD를 기준으로 하며, 데이터셋에 대한 보다 상세한 분석과 속성 및 객체 간 관계에 대한 통계는 부록 자료 [5]에 제시되어 있다.
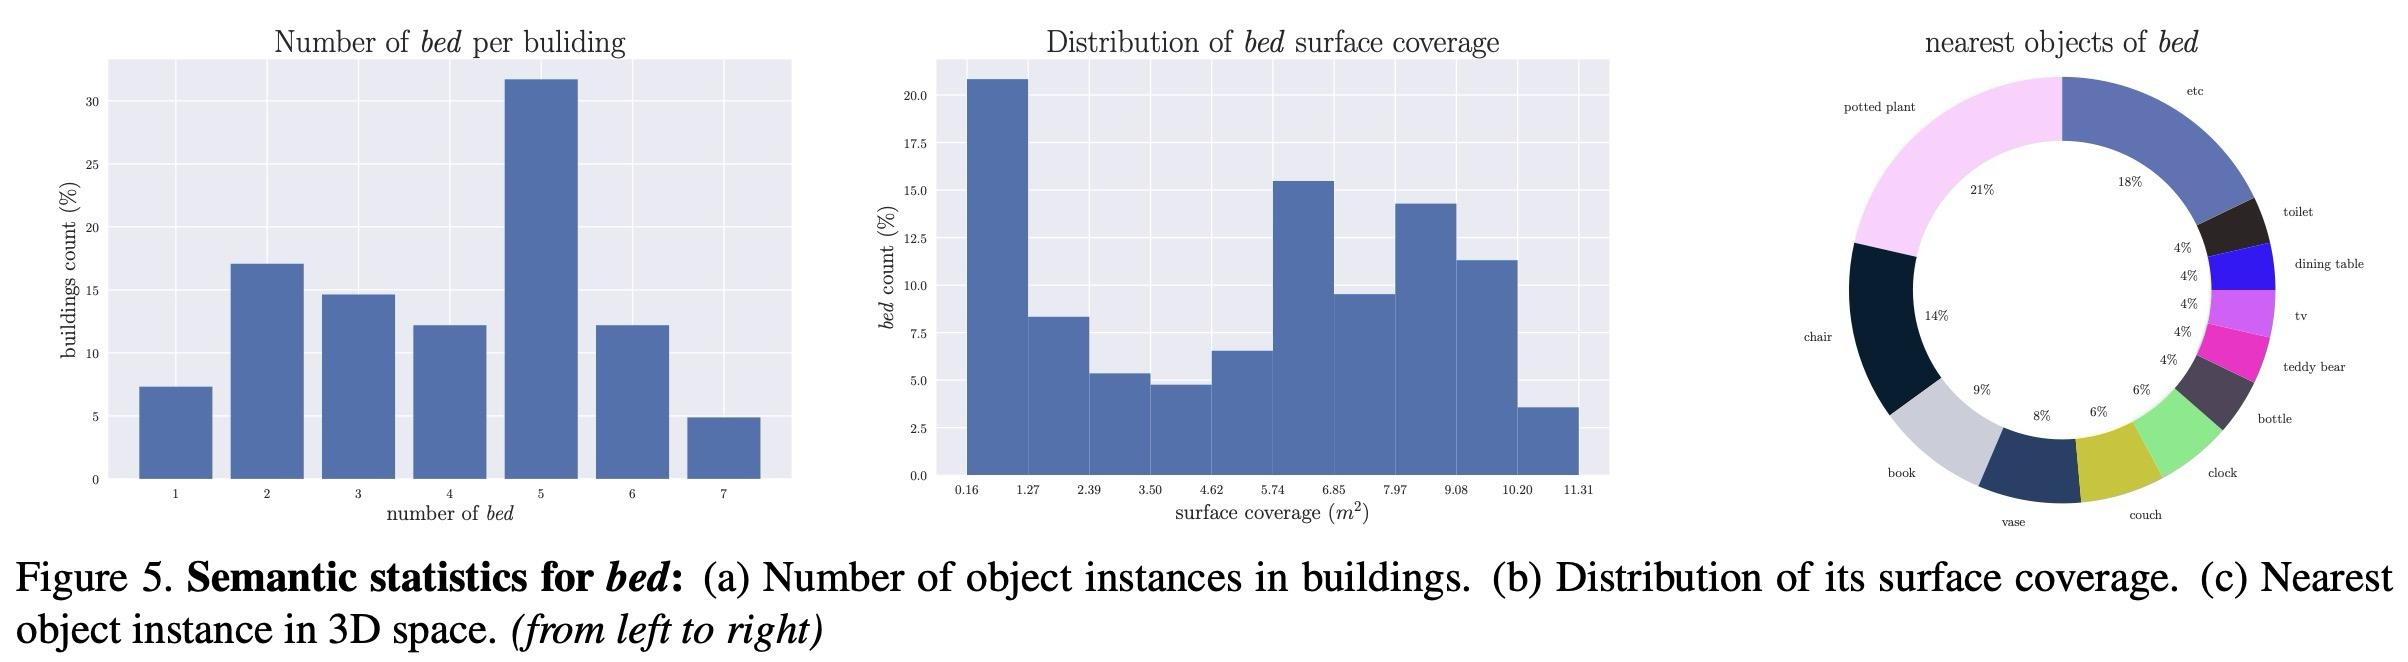
본문에서는 예시로서 침대(bed) 객체 클래스에 대한 의미 통계 결과를 Figure 5에 제시한다.
Gibson 자체는 geometry와 panorama를 제공하고, 이 논문은 그 위에 semantic modality를 얹는다.
| 축 | 기준 / 출처 | 논문에서 쓰인 방식 |
|---|---|---|
3D Geometry | Gibson Environment | 572개 full building, 3D mesh, RGB panorama, camera pose |
Object Category | COCO category | object label과 instance mask 생성 기준 |
Material | MINC / manual annotation | 자동 방법이 충분하지 않아 일부 수동 정의 |
Texture / Scene | DTD / Places 계열 semantic source | 부록 통계와 graph attribute 분석에 활용 |
5.2. Evaluation of Automated Pipeline
제안된 자동 파이프라인은 2D 파노라마와 3D Mesh 모델 양쪽에서 평가되었으며, COCO evaluation protocol을 따르고 평균 정밀도(AP, Average Precision)와 평균 재현율(AR, Average Recall)을 보여준다.
기본 검출기로는 COCO dataset으로 학습된 Mask R-CNN을 사용했으며, Detectron에서 만들어진 Bells & Whistles 버전을 선택하였다. 해당 모델은 ResNeXt-152(32×8d)와 Feature Pyramid Network(FPN)의 조합을 사용하고, ImageNet-5K로 사전 학습 후 COCO 데이터셋으로 fine-tuning되었다.
2D/3D 평가는 같은 robustification 단계가 서로 다른 공간에서 어떻게 누적 효과를 내는지 보는 구조다.
| 평가 공간 | Baseline | 중간 단계 | 최종 단계 | 측정값 |
|---|---|---|---|---|
2D Panorama | Mask R-CNN을 6개 rectilinear view에 적용 후 panorama로 재투영 | Mask R-CNN + Framing | Mask R-CNN + Framing + MVC | COCO protocol AP / AR |
3D Mesh | Mask R-CNN 결과를 mesh 표면에 단순 다수결 투표 | Framing 후 2D→3D projection | Framing + MVC로 3D label consistency 적용 | COCO protocol AP / AR |
정량 평가는 같은 세 단계가 2D panorama와 3D mesh에서 각각 어떻게 누적되는지 비교한다.
Mask R-CNN → Mask R-CNN + Framing → Mask R-CNN + Framing + MVC
검출 결과를 panorama로 재투영하여 AP/AR 측정Panorama projection → Framing + projection → Framing + MVC
mesh surface label의 AP/AR로 3D consistency 평가핵심 증거는 AP 상승 자체보다, 각 robustification 단계가 서로 다른 detector 오류를 제거한다는 점이다.
- Mask R-CNN AP 0.079
- Framing 적용 AP 0.160
- Framing + MVC AP 0.485
- Panorama projection AP 0.222
- Framing + projection AP 0.306
- Framing + MVC AP 0.409
Framing은 일부 false detection을 줄이고, MVC는 반사·leakage·view별 불일치를 추가로 정리한다.
AP 증가는 graph construction constraint가 단순 wrapper가 아니라 실제 보정 역할을 한다는 근거다.
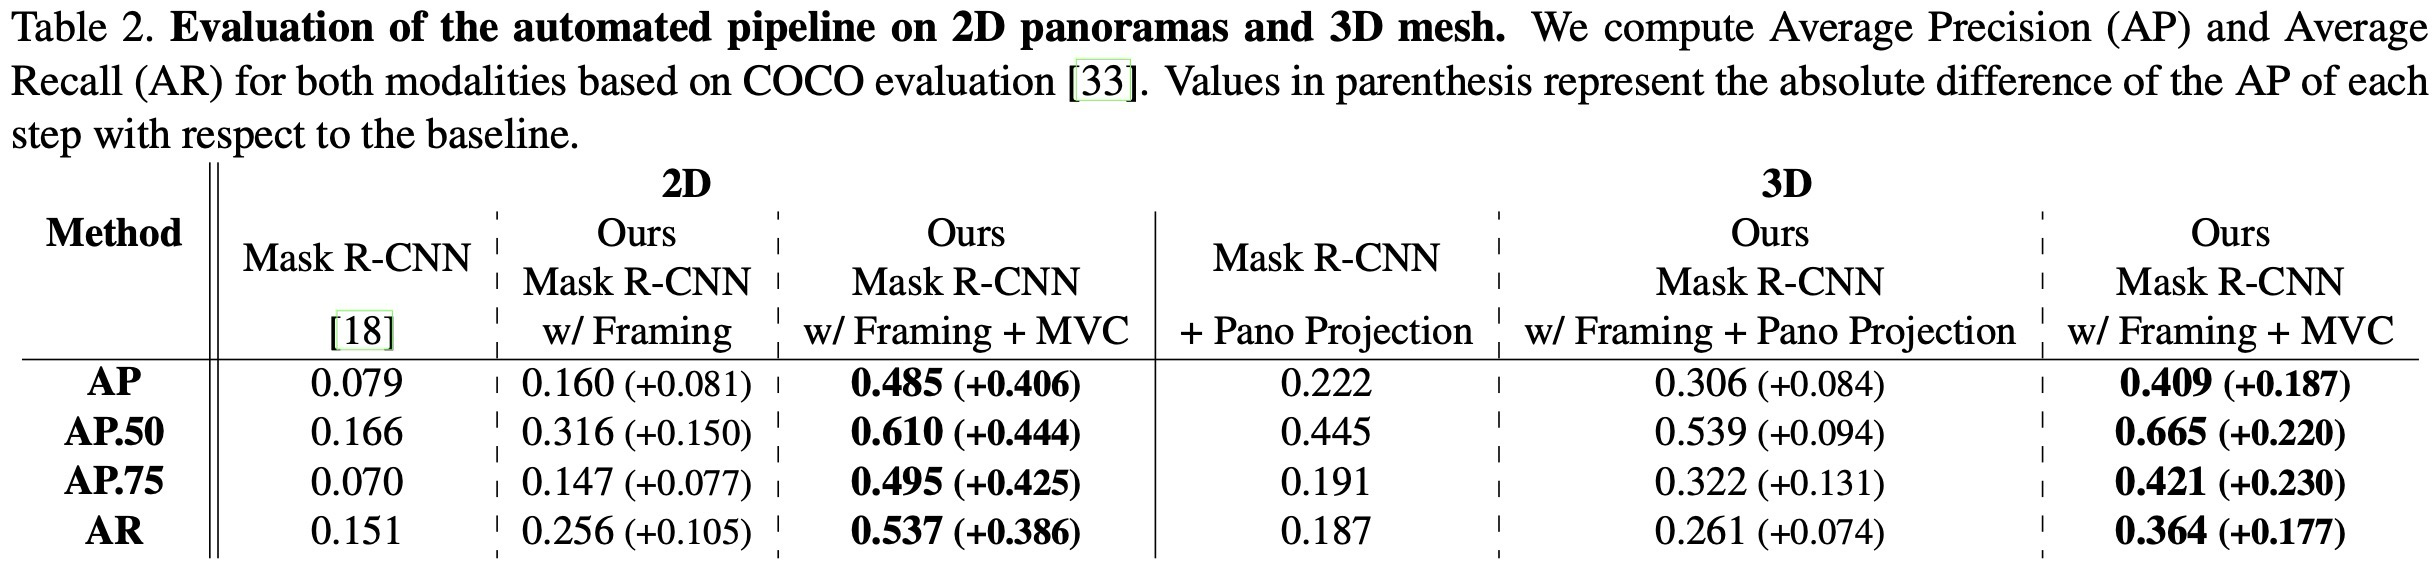
Table 2에 따르면, 각 강건화 단계는 AP와 AR 모두에서 정확도를 점진적으로 향상시키며, 정성적 결과에서도 오검출이 제거되는 것을 확인할 수 있다.
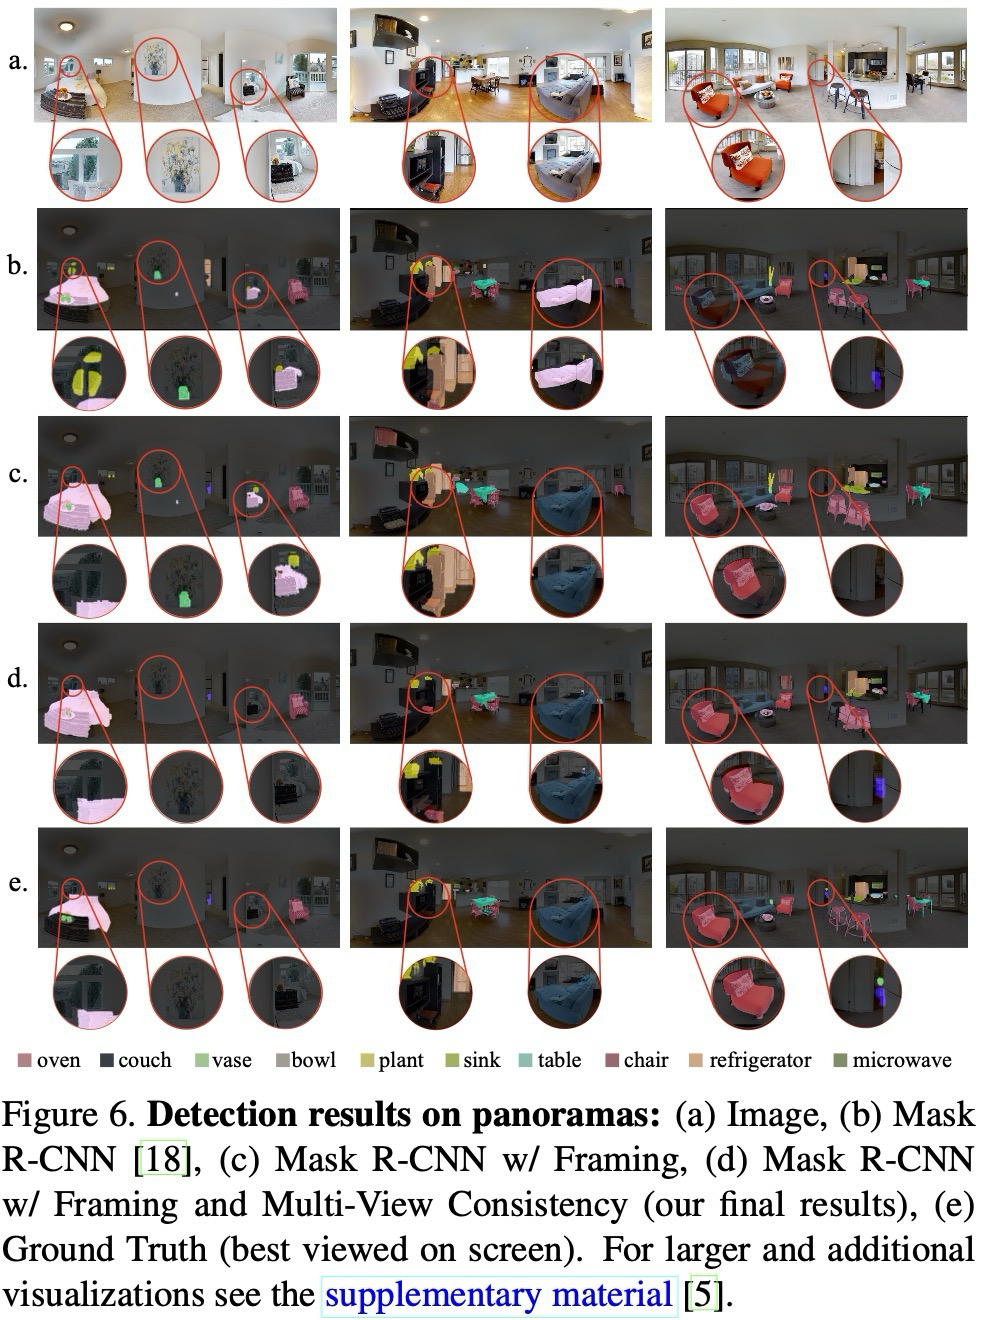
예를 들어, 2D 평가(Figure 6)에서 기본 Mask R-CNN(b)은 창 밖의 나무를 화분으로, 그림 속 꽃병을 실제 객체로, 거울 속 침대 반사를 객체로 오검출했으나, Framing(c) 단계에서 나무 오검출이 제거되고, 가려진 변기(toilet) 검출이 복구되었다. Framing + MVC(d)에서는 그림 속 꽃병과 침대 반사까지 제거되어 거의 정답(GT)과 일치하는 결과를 달성하였다.
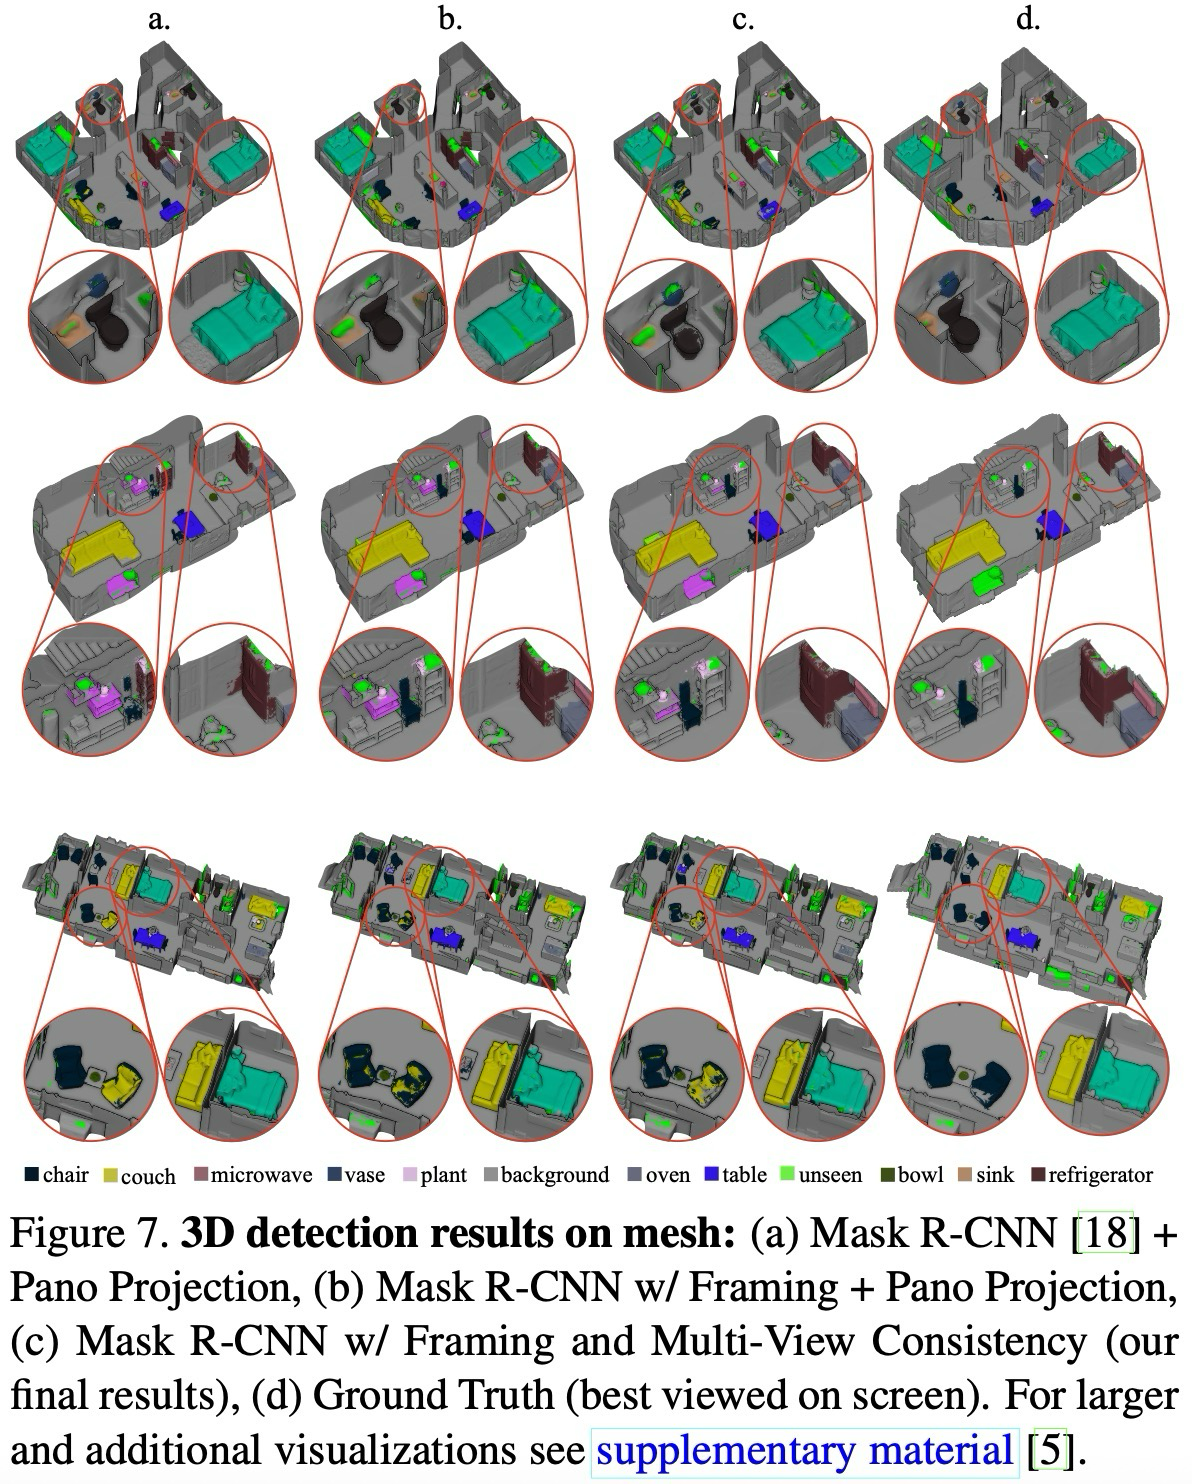
3D 평가(Figure 7)에서도 유사한 개선이 관찰되며, 정량적 평가의 향상 폭이 크지 않더라도 지역적 일관성과 객체 경계 정확성을 확보하는 결정적 역할을 하였다.
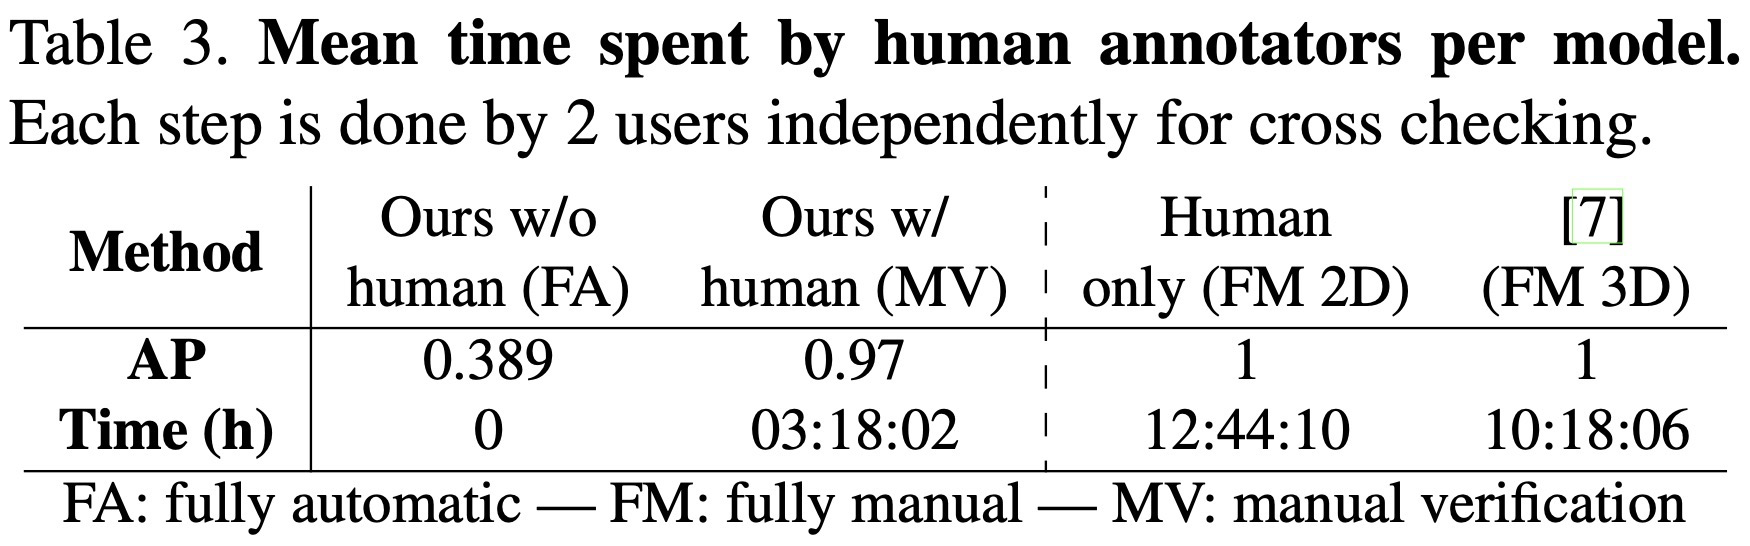
Table 3에서는 인간 노동력(Human Labor) 측면에서 사용자 연구를 통해, 검출 성능과 작업 시간(시간 단위) 간의 관계를 분석하였으며, 12개 객체 클래스에 대해 3D annotator 전문가가 완전 수동 3D annotation을 진행한 시간, 62개 객체 클래스에 대해 제안하는 방법을 이용하여 완전 자동 annotation을 수행한 시간, 3D annotation 비숙련자가 제안하는 방법을 사용하여 annotation을 수행한 시간을 비교하여 보여준다.
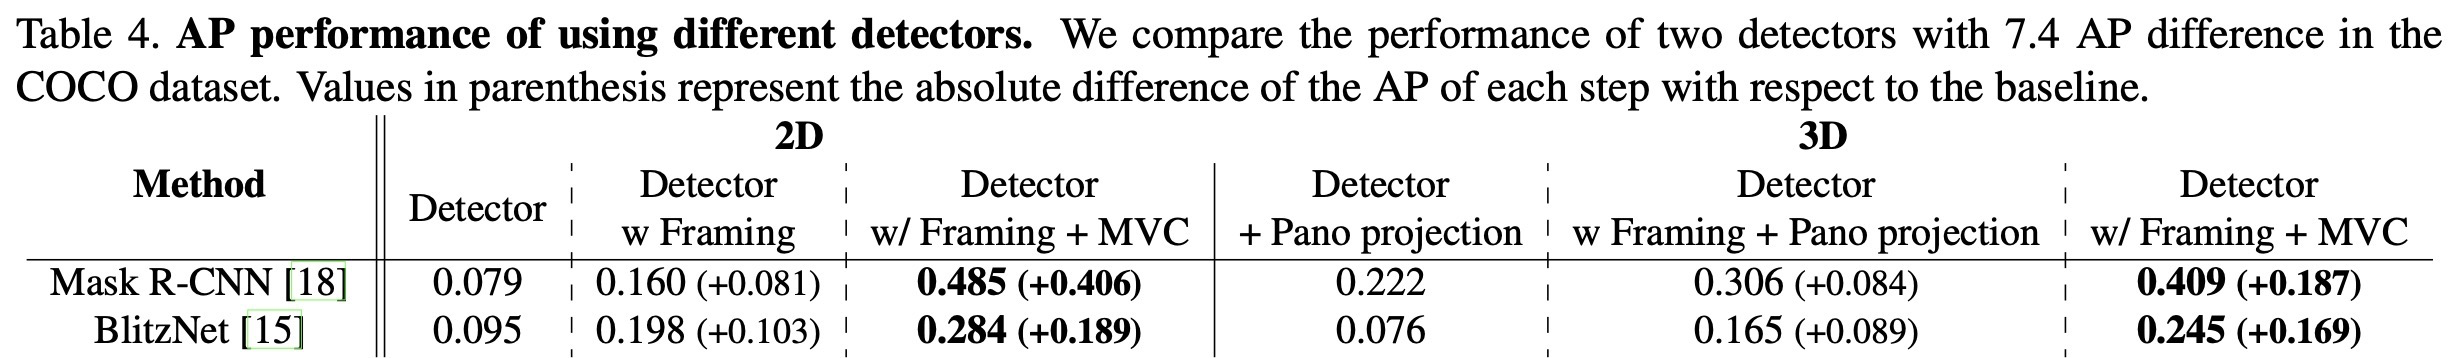
마지막으로 초기에는 COCO dataset에서 AP 41.5를 기록한 Mask R-CNN을 사용했지만, 성능이 낮고 추론 속도가 빠른 BlitzNet(COCO AP 34.1)에서도 동일한 실험을 수행하였고, 결과적으로 두 강건화 메커니즘(Framing, MVC)이 서로 다른 baseline들의 AP 증가에 미치는 상대적 향상 효과가 유사하게 관찰되어, 제안된 메커니즘이 초기 검출기의 정확도(prediction)와 관계없이 표준 검출기의 성능을 향상시키고 오류를 보정할 수 있음을 확인하였다.
5.3. 2D Scene Graph Prediction
지금까지 자동 검출 결과에 초점을 맞췄다면, 이후 이 결과들은 자동화된 단계를 거쳐 최종 3D Scene Graph를 생성하고 객체 속성(attributes)과 관계(relationships)를 계산한다. 이에 대한 세부 결과는 부록 자료[5]에서 확인할 수 있으며, 이 출력은 2D Scene Graph 예측 실험에도 활용된다.
표준 2D scene graph 평가는 입력으로 무엇을 이미 알고 있다고 가정하는지에 따라 난이도가 달라진다.
| 설정 | 입력에서 주어지는 것 | 예측해야 하는 것 | 이 논문에서의 해석 |
|---|---|---|---|
Scene Graph Detection | 입력 이미지 | bounding box, object category, relationship predicate | 가장 어려운 end-to-end 설정 |
Scene Graph Classification | 이미지 + GT bounding box | object category와 relationship predicate | object 위치는 알고 category/관계를 예측 |
Predicate Classification | 이미지 + GT bounding box + GT object category | relationship predicate | 3D Scene Graph의 관계 정보가 직접 연결되는 설정 |
세 설정은 “입력에서 이미 알고 있는 정보가 얼마나 많은가”에 따라 난이도가 달라진다.
image만 주어지고 box/category/predicate를 모두 예측
GT bounding box는 주어지고 category와 predicate 예측
GT box와 GT category가 주어지고 relationship predicate만 예측
Visual Genome과 달리, 제안하는 3D Scene Graph는 매우 밀집(dense)하여 일부 평가(e.g. 관계 탐지)에는 적용하기 어렵다. 따라서 본 연구에서는 관계 분류(relationship classification)에 집중하며, 공간적 순서(spatial order), 상대적 부피(relative volume), 아모달 마스크 분할(amodal mask segmentation)을 대표 task로 보고한다.
세 task는 3D graph의 relationship edge가 실제 2D 예측 문제로 어떻게 내려오는지 보여준다.
query object가 다른 object의 앞/뒤, 좌/우 어디에 있는지 예측
query object가 다른 object보다 작은지/큰지 분류
occlusion이 있어도 object의 전체 2D 영역을 추론
graph가 매우 dense하기 때문에, 논문은 sparse scene graph detection보다 relationship classification에 초점을 둔다.
query object가 다른 object의 앞/뒤 또는 좌/우에 있는지 예측한다.
query object가 다른 object보다 작은지/큰지 분류한다.
추가 annotation 없이 3D semantics로 가려진 object의 전체 영역을 추론한다.
relationship edge가 단순 metadata가 아니라 downstream task의 supervision으로 쓰일 수 있음을 보여준다.
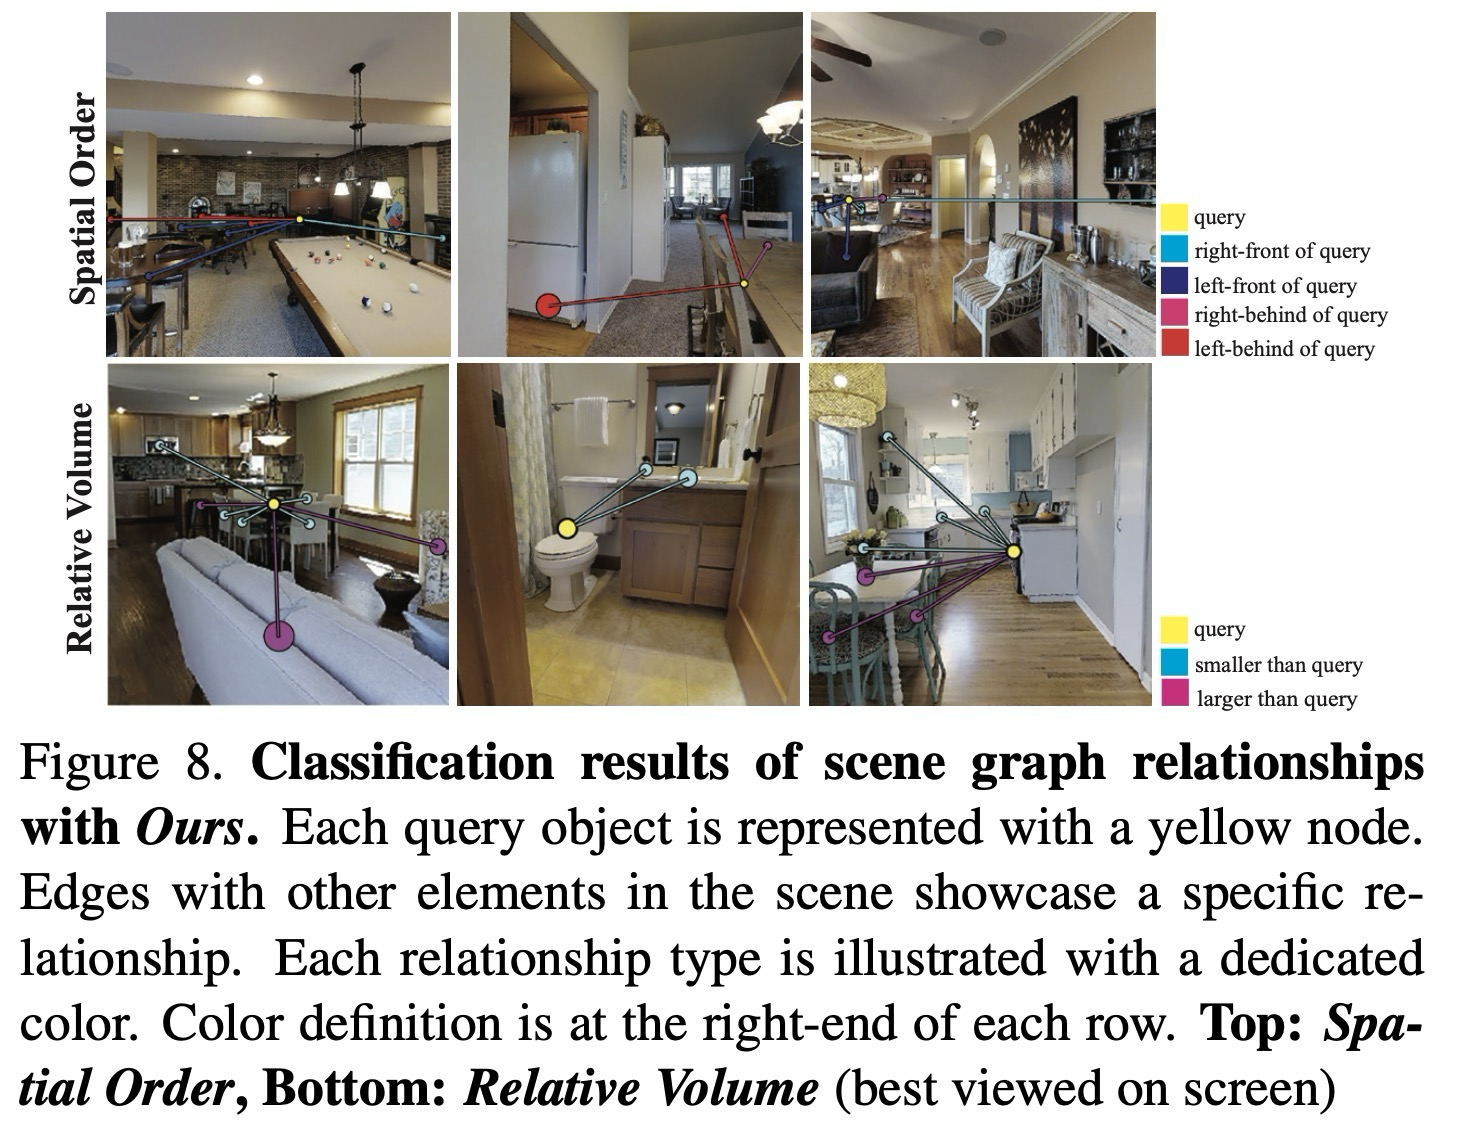
공간적 순서(Spatial Order)
- RGB 직교 이미지와 객체 쌍의 segmentation mask를 입력으로, query 객체가 다른 객체의 앞/뒤, 좌/우 어느 위치에 있는지 예측하는 문제이다.
- 자동 생성된 segmentation mask를 이용해 ResNet34를 학습시키고, medium Gibson split를 사용하였다. Baseline은 훈련 데이터에서 통계적으로 추출한 추측(Statistically Informed Guess)이다.
상대적 부피(Relative Volume)
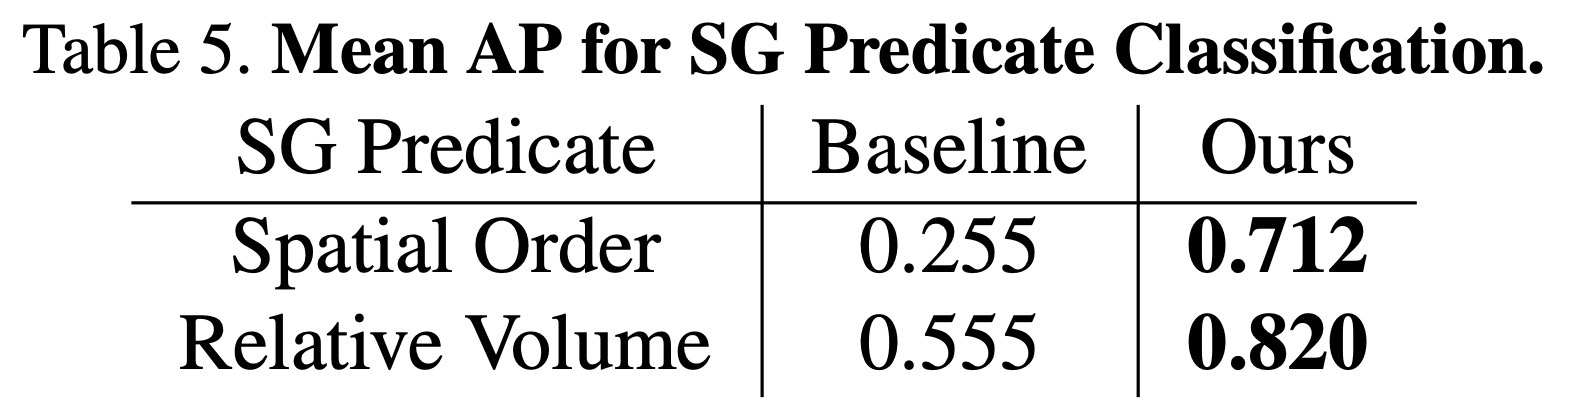
- 동일 설정(setup)에서 query 객체가 다른 객체보다 부피가 작은지 큰지 예측하는 문제이며, 두 작업(Spatial Order, Relative Volume)의 예측 결과는 Figure 8, 정량 평가 결과는 Table 5에 제시되어 있다.
Amodal mask 실험은 3D semantic 정보를 이용해 보이지 않는 object 영역까지 추론할 수 있는지를 확인한다.
부분적으로 가려진 object의 전체 2D amodal segmentation 예측
semantic class와 무관하게 visible/occlusion mask를 픽셀 단위로 학습
전체 평균 amodal mask와 class-specific 평균 amodal mask를 비교 기준으로 사용
- 데이터 생성 및 실험 설정에 대한 자세한 내용은 부록[5]에 있으며, 평가 지표로는 픽셀 단위로 세 가지 클래스(empty, occluded, visible)에 대한 f1-score와 IoU(intersection-over-union)를 산출하고, 매크로(macro) 평균을 보고하였다(Table 6).
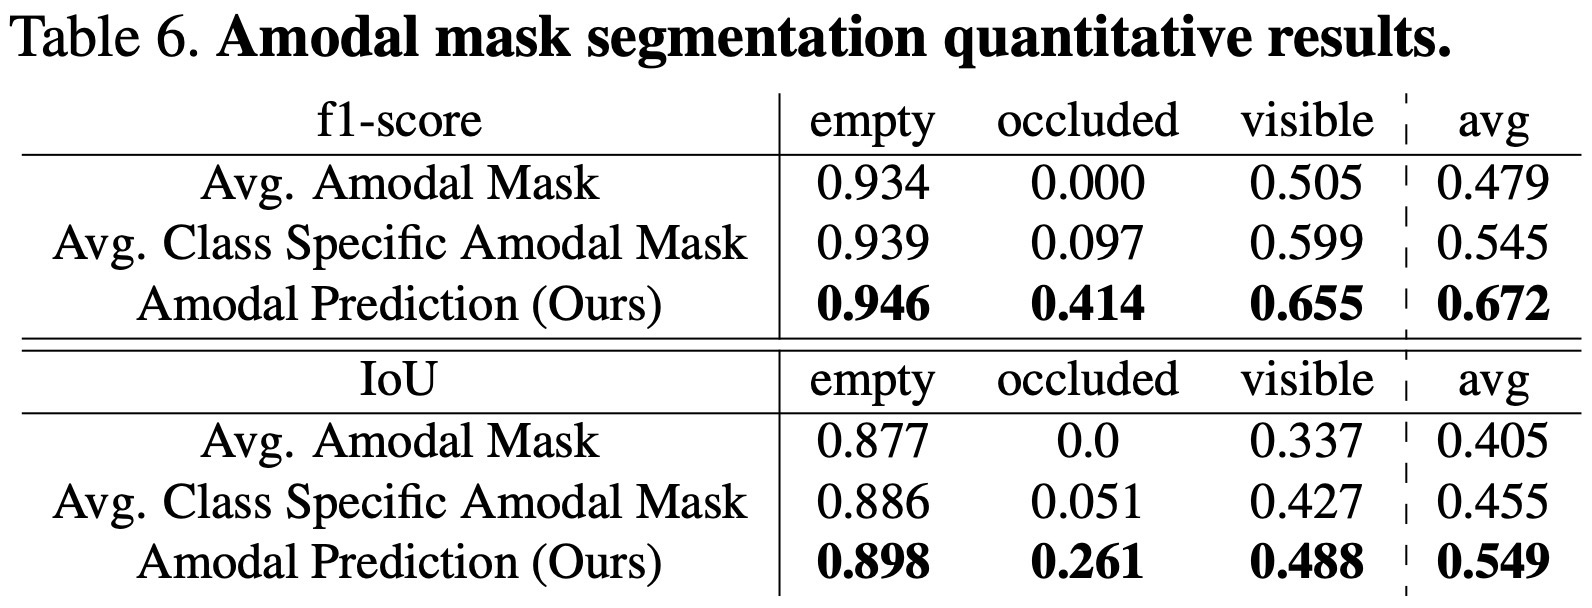
Table 6. Amodal mask segmentation 정량 결과.occluded/visible/full mask 예측을 macro average와 함께 비교.
- 빈 클래스(empty)의 편향이 커 성능 차이가 눈에 크게 드러나지 않을 수 있으나, 제안하는 방법은 차폐 영역(occluded area) 예측에서 꾸준한 성능 향상을 보여 아모달 지각(amodal perception)을 효과적으로 학습했음을 확인할 수 있다(Figure 9).
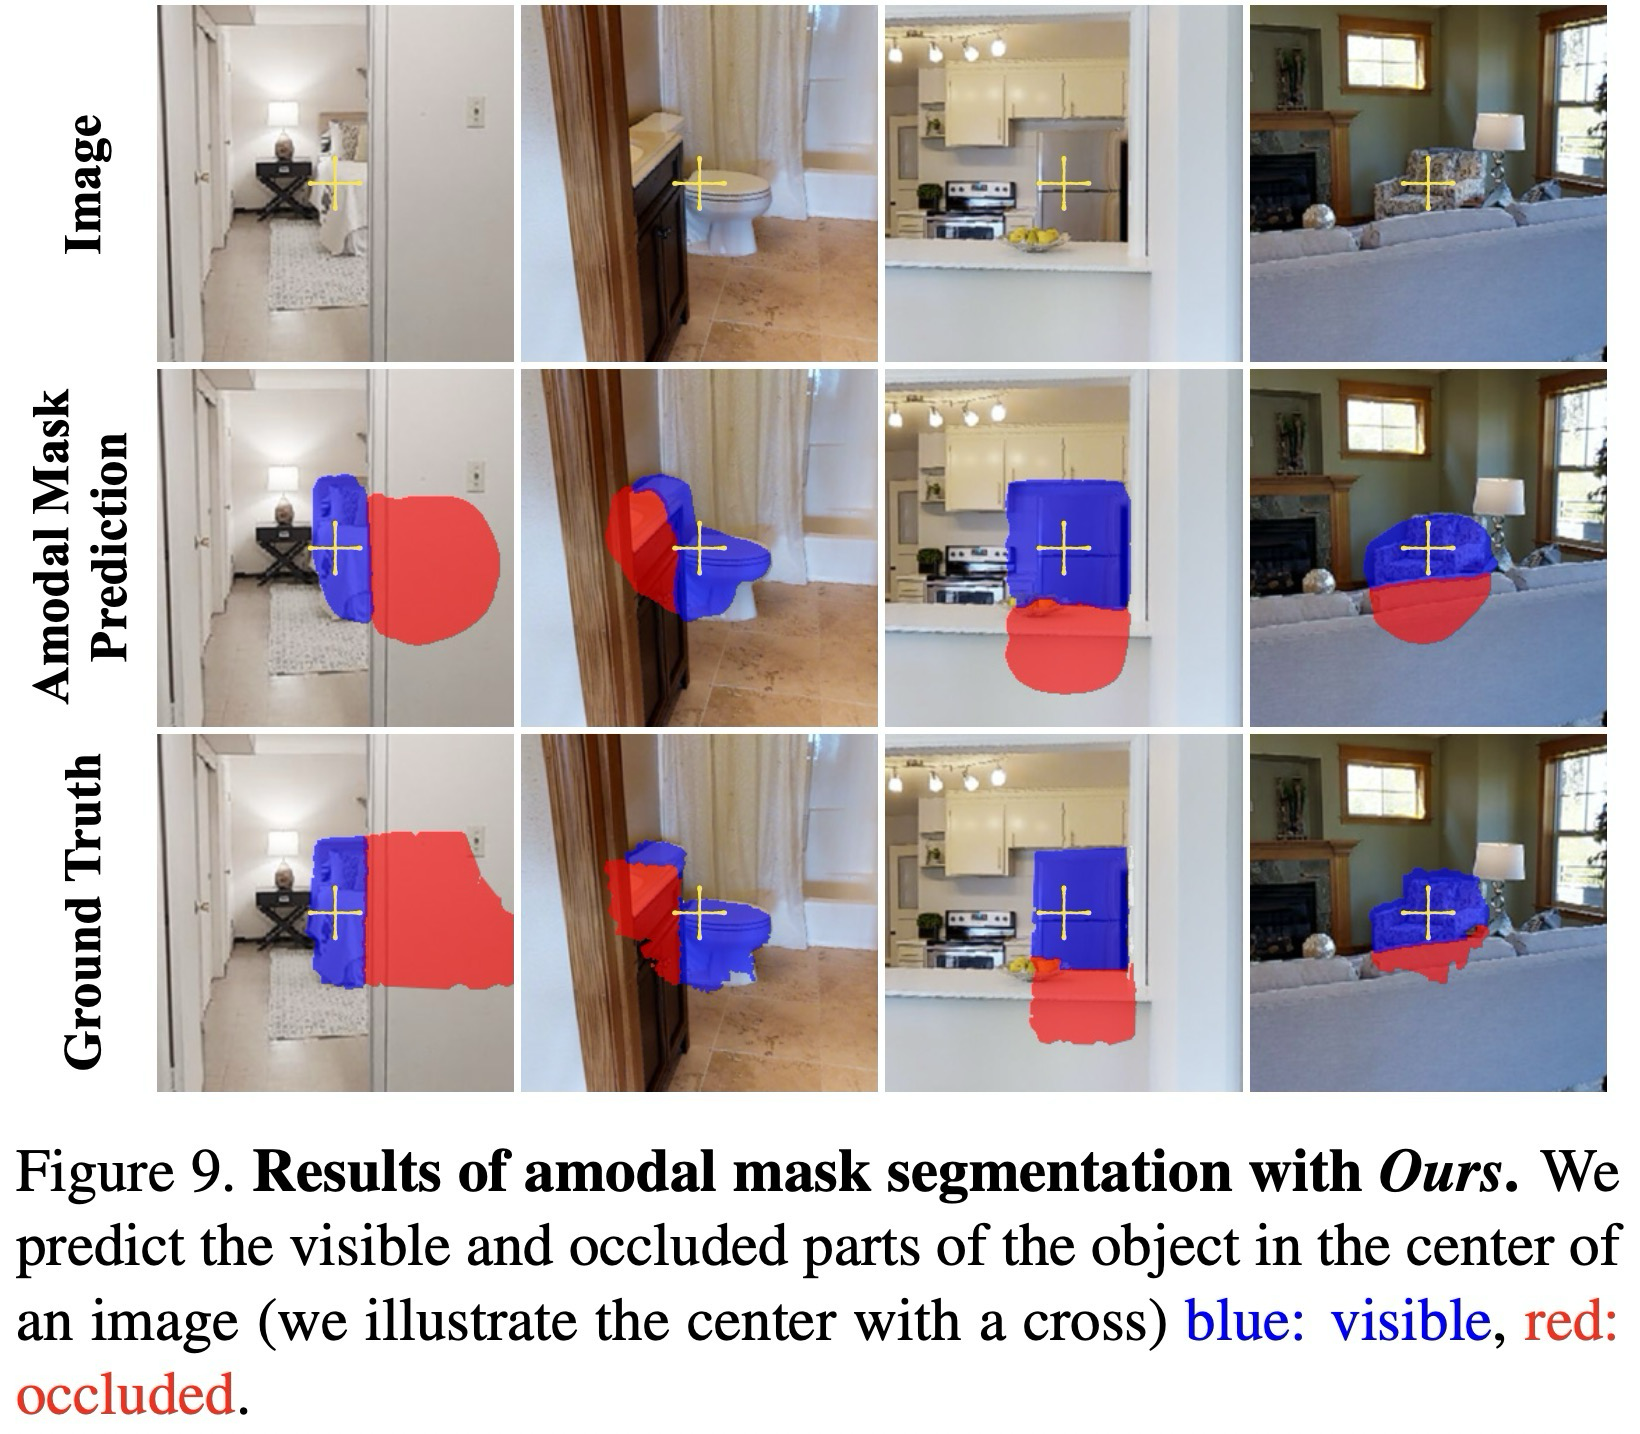
Figure 9. Amodal mask prediction 정성 결과.파란색은 visible region, 빨간색은 occluded region을 나타냄.
Usage / Limits: unified scene representation은 언제 유용한가
본 연구에서는 객체, 3D 공간, 카메라 간의 관계를 설정하여 멀티모달 3D 의미 정보를 통합 구조에 기반으로 표현하는 방법을 논의하였다. 이러한 구조는 기존의 다양한 과제에 대한 새로운 인사이트를 제공할 뿐만 아니라, 의미 정보 자원의 교차점에서 새로운 연구 과제를 제안한다.
3D Scene Graph를 구축하기 위해, 저자는 과 를 활용하여, 기존 학습 시스템의 강건성을 높이는 주로 자동화된 접근법을 제시하였다. 또한 이를 Gibson 데이터셋에서 시연하였으며, 해당 3D Scene Graph 결과는 공개되어 있다.
향후 계획으로, 현재 일부 공간에서 annotation이 드문 점을 고려하여, 실내 환경에서 일반적으로 나타나는 객체 카테고리를 더 확장할 예정이다.
느낀점
3D 실내 공간의 중요한 의미 정보들을 하나의 3D Scene Graph로 정의하여, 여러 task에 적용할 수 있는 기반을 만들어 준 좋은 논문이라고 생각한다.
다만 본 논문이나, 부록 자료[5]를 찾아봐도 실내 가정집 환경 이외에 다른 실내 환경(e.g. 오피스, 레스토랑, 공사장 등)에 대한 평가 결과는 다루지 않아서 살짝 아쉽긴 했다.
Problem: why unify 3D space and semantics?
The abstract frames the paper as a unified semantic representation, not merely an object detection pipeline.
| Question | Answer | Why it matters |
|---|---|---|
Where should semantics live? | On the underlying 3D mesh | Semantics become less dependent on a single image view |
What structure is used? | A layered graph spanning buildings, rooms, objects, and cameras | Attributes and relationships can be queried together |
How is labor reduced? | Existing detectors are strengthened by framing and multi-view consistency | The graph can be built semi-automatically at Gibson scale |
A comprehensive semantic understanding of a scene requires a stable place to ground objects, materials, room types, shape, camera information, and relationships. The paper argues that images are too view-dependent for this role, so it follows the scene graph paradigm in 3D.
Given a 3D mesh and registered panoramic images, the method builds a graph over the entire building. The graph contains semantics for objects, rooms, and cameras, as well as relationships between these entities.
The main construction problem is labor cost. The paper therefore uses existing detection methods and improves them with two constraints: framing of panorama-sampled query images and multi-view consistency across detections from different camera locations.
These constraints do not replace the detector. They stabilize its outputs in 2D first, then in 3D.
Samples detector-friendly rectilinear query images from panoramas.
Aggregates observations from multiple camera locations on the mesh.
Context: why scene understanding is fragmented
The introduction asks what kind of semantic storage can be invariant, structured, and connected back to visual observations.
| Candidate | Strength | Limitation / paper's view |
|---|---|---|
Images | Directly connected to vision tasks | Sensitive to viewpoint, parameters, crop, and occlusion |
3D space | Stable geometry and deterministic projection to images/depth | Needs semantic annotation on the mesh |
Scene graph | More structured than captions and richer than class labels | Needs to be lifted from 2D into 3D |
The paper first argues that a useful semantic space should be invariant to many changes and should connect deterministically to output domains such as images, videos, and depth. A 3D mesh satisfies this better than raw images because it contains geometry and can be projected into multiple camera views.
The paper's preferred storage space has two requirements.
Less sensitive to viewpoint, crop, occlusion, and camera parameter changes.
Can project semantics back to images, video, depth, and other observation domains.
Scene graphs are chosen as the structure because they can store not only object categories but also attributes and relationships. The paper's key move is to combine the scene graph idea with 3D space and camera information.
The contributions are: grounding scene graphs in 3D space, proposing a robust semi-automatic construction method, augmenting Gibson with a 3D Scene Graph modality, and demonstrating downstream tasks that use the resulting relationships.
The contributions read most clearly as representation, construction, and public modality.
Moves scene graphs from image-only semantics into 3D space.
Uses framing and MVC to make detector-based graph construction practical.
Releases 3D Scene Graphs as an additional semantic layer for Gibson.
Gap: what is missing between metric maps and semantic graphs?
The related work matters mainly as a map of what this paper combines.
| Line of work | Typical focus | This paper's move |
|---|---|---|
Scene graphs | 2D objects, attributes, and relations | Extends the graph to 3D space and cameras |
Semantic databases | Fragmented labels, masks, materials, scene categories | Unifies multimodal semantics on Gibson meshes |
Semi-automatic annotation | Human verification of 2D/3D annotations | Improves automatic output first through framing and MVC |
After Visual Genome, scene graphs are often used in four recurring ways.
Generate objects and relation graphs from images.
Use graph structure as an intermediate representation for language.
Search by object-relation structure.
Support object-relation reasoning for visual questions.
Related work details
This supplement positions 3D Scene Graphs across scene graphs, semantic 3D mapping, and multi-view grounding.
Represent objects and relations as a semantic graph.
Places objects, rooms, and camera poses in a shared 3D structure.
Connects the graph to retrieval, grounding, and question-answering tasks.
Visual Genome provides 2D scene graphs based on object and relationship annotations, but it is image-grounded and manually normalized. Semantic databases such as 2D-3D-S, Matterport3D, Gibson, MINC, DTD, and Places cover useful modalities but remain fragmented by data type or task.
Graph structures have also been used in navigation and holistic scene parsing, but this paper focuses on global 3D relationships and multimodal semantic grounding. Annotation tools such as Polygon-RNN, ScanNet-style interfaces, and other semi-automatic methods reduce labor, yet still rely heavily on human interaction for accurate 3D semantics.
Mechanism: what a 3D Scene Graph stores
The output is a four-layer graph where each node has attributes and edges encode relationships.
| Layer | Attributes | Relationships | Reading point |
|---|---|---|---|
Building | function, floors, area, size, volume | root / parent reference | Represents the scanned space |
Rooms | scene category, illumination, size, volume | parent building, relative magnitude | Provides spatial context |
Objects | class, material, shape, mesh segmentation, volume | occlusion, spatial order, same room, relative volume | Main entities for downstream relationship tasks |
Cameras | pose, FOV, modality, resolution | parent space | Connects 3D semantics back to observations |
Graph structure details
The input is a 3D mesh model with registered RGB panoramas and camera parameters. The output is a layered 3D Scene Graph. Attributes can include object class, material, 3D shape, pose, room category, and camera information. Relationships can span within or across layers, such as object-object occlusion, camera-room parent space, or relative volume.
The hierarchy descends from the whole scanned space to rooms, objects, and observation points.
Root node representing the full scanned building.
Spatial context inside the building.
Mesh-grounded object entity used by relationship tasks.
Camera pose and observation metadata connected back to the graph.
Mechanism: how framing and MVC construct the graph
This section explains how imperfect 2D detections are lifted into a consistent 3D graph.
| Step | Role | Key idea | Error addressed |
|---|---|---|---|
Framing | Samples detector-friendly views from panoramas | Center the object and keep enough context | Boundary crops and missed detections |
Weighted voting | Aggregates rectilinear detections onto the panorama | Weight confidence and distance from image center | Noisy local detections |
Multi-view consistency | Combines projections on the 3D mesh | Use multiple camera observations with distance-based weights | Label leakage and registration errors |
Graph completion | Computes remaining attributes and relationships | Use analytical computation and off-the-shelf methods | Turns segmentation into graph entities and edges |
Reframe panoramas so the 2D detector sees objects in easier rectilinear views.
Fuse camera-view projections on the 3D mesh to stabilize semantic output.
Framing / MVC implementation details
Framing densely samples rectilinear images from each panorama using yaw, pitch, and field-of-view settings. The detector runs on these query images, and detections are aggregated back to the panorama by weighted voting.
Place the object near the center of the query view to reduce boundary crops.
Make the object larger while keeping enough surrounding context.
Multi-view consistency projects panorama labels onto the mesh and aggregates votes across camera locations. This is important because single-view projection can leak labels onto neighboring objects or suffer from reconstruction and registration errors.
The post-processing stage is best read as graph-quality refinement rather than as the core detector pipeline.
| Stage | Input | Processing | Output |
|---|---|---|---|
Verification | Automatically extracted mesh labels | Check labels/masks in rectilinear views and add missing objects | Verified object masks and labels |
Room / Object Attributes | Object elements and room segmentation | Combine public methods with analytical computation | Room category, object volume, material, and related attributes |
Relationships | 3D object geometry and camera poses | Use ray tracing, convex-hull volume, and spatial comparison | Amodal masks, occlusion, spatial order, and relative volume |
4.1. User-in-the-loop verification
A final manual verification interface can correct automatic outputs, but the authors state that the fully automatic results are already robust enough for practical uses. Verification is mainly used for evaluation and for forming error-free data in selected use cases.
The human loop checks a small set of graph-quality failure modes rather than rebuilding the graph from scratch.
Verify that object categories are correct in rectilinear views.
Inspect whether projected masks align with the target object.
Add instances that the automatic detector missed.
The second manual pass finds missing instances until every object in the category is covered.
Inspect whether instances of the chosen object category were skipped.
Add missing masks until all objects in that category are covered.
4.2. Computation of attributes and relationships
After object elements are extracted, room elements, attributes, and relationships are computed using a mixture of off-the-shelf methods and analytical computation. For example, amodal masks can be obtained by ray tracing on the mesh, and relative volume can be computed from convex hull volumes.
Detected with an existing room-level method from the cited work.
Volume is computed from convex hulls; material remains manually assigned because automatic recognition is weak.
Evidence: which queries and tasks test it?
The experiments test whether the graph can be built accurately, cheaply, and usefully for relationship tasks.
| Evidence | What it checks | Main result |
|---|---|---|
Automated pipeline | Framing and MVC improve AP/AR | 2D AP rises from 0.079 to 0.485; 3D AP from 0.222 to 0.409 |
Human labor | Annotation cost reduction | Fully automatic AP 0.389; manual verification reaches AP 0.97 |
Different detectors | Robustification generality | Mask R-CNN and BlitzNet both gain from framing and MVC |
Scene graph tasks | Usefulness of relationships | Spatial order, relative volume, and amodal mask tasks use graph outputs |
Evaluation details
5.1. Dataset Statistics
The evaluation uses Gibson, which contains hundreds of full buildings with 3D mesh models, RGB panoramas, and camera poses. The graph adds semantic annotations and relationship information as an additional modality.
Gibson provides geometry and panoramas; this paper adds a semantic graph modality on top of them.
| Axis | Source / criterion | How it is used |
|---|---|---|
3D Geometry | Gibson Environment | 572 full buildings with meshes, RGB panoramas, and camera poses |
Object Category | COCO categories | Basis for object labels and instance masks |
Material | MINC / manual annotation | Some material attributes are manually defined because automatic methods are not accurate enough |
Texture / Scene | DTD / Places-style semantic sources | Supports appendix statistics and graph attribute analysis |
5.2. Evaluation of Automated Pipeline
The 2D and 3D evaluations ask whether the same robustification steps accumulate benefits in different spaces.
| Evaluation space | Baseline | Intermediate step | Final step | Metric |
|---|---|---|---|---|
2D Panorama | Run Mask R-CNN on six rectilinear views, then reproject to the panorama | Mask R-CNN + framing | Mask R-CNN + framing + MVC | COCO protocol AP / AR |
3D Mesh | Project Mask R-CNN results to mesh surfaces with simple majority voting | Framing followed by 2D-to-3D projection | Framing + MVC for 3D label consistency | COCO protocol AP / AR |
The same three-stage robustification chain is evaluated in 2D panorama space and 3D mesh space.
Mask R-CNN -> Mask R-CNN + framing -> Mask R-CNN + framing + MVC
AP/AR after reprojecting detections to panoramas.Panorama projection -> framing projection -> framing + MVC
AP/AR on mesh-surface semantic labels.The key evidence is not only higher AP, but that each robustification step removes a different class of detector error.
- Mask R-CNN AP 0.079
- With framing AP 0.160
- With framing + MVC AP 0.485
- Pano projection AP 0.222
- Framing + projection AP 0.306
- Framing + MVC AP 0.409
Framing removes some false detections; MVC further cleans reflection, leakage, and inconsistent local regions.
AP gains are evidence that the graph-construction constraints are doing real work, not just wrapping Mask R-CNN.
5.3. 2D Scene Graph Prediction
Standard 2D scene graph tasks differ by what is already given as input.
| Setup | Given input | Prediction target | How to read it here |
|---|---|---|---|
Scene Graph Detection | Input image only | Bounding boxes, object categories, and relationship predicates | Hardest end-to-end setting |
Scene Graph Classification | Image + GT bounding boxes | Object categories and relationship predicates | Object locations are fixed; categories and relations remain |
Predicate Classification | Image + GT boxes + GT object categories | Relationship predicates | Closest to how 3D Scene Graph relationship edges are used |
The three standard scene-graph settings differ by how much ground-truth input is already provided.
Predict boxes, categories, and predicates from the image alone.
Use ground-truth boxes, then predict categories and predicates.
Use ground-truth boxes and categories, then predict only relationships.
The graph is dense, so the paper focuses on relationship classification rather than the standard sparse scene graph detection setup.
Predicts whether a query object is front/behind or left/right relative to another object.
Predicts whether the query object is smaller or larger than another object.
Uses 3D semantics to infer the full extent of partially occluded objects without extra annotation.
These tasks show why relationship edges in the graph are more than metadata.
The tasks show how 3D relationship edges become 2D prediction problems.
Predict front/back or left/right relations between objects.
Classify whether one object is larger or smaller than another.
Infer the full 2D region of partially occluded objects.
The amodal experiment asks whether 3D semantics can recover object extent beyond visible pixels.
Predict full amodal segmentation for partially hidden objects.
Trains visible and occluded masks at the pixel level.
Compares against global and class-specific mean amodal masks.
Usage / Limits: when is unified scene representation useful?
The paper grounds multimodal 3D semantic information in a unified graph structure that relates objects, 3D space, and cameras. This structure can provide new insight for existing tasks and define new tasks at the intersection of semantic resources.
The construction method uses framing and multi-view consistency to improve the robustness of current learning systems, then demonstrates the resulting 3D Scene Graphs on Gibson. The released results make the graph usable as a new semantic modality.
The important takeaway is that 3D Scene Graphs are useful because they make semantic information reusable across views and tasks. The detector pipeline is a means to build that representation at scale.
Takeaway
This is a useful paper because it defines a structured semantic layer for indoor 3D environments and shows how that layer can support multiple downstream tasks.
The main limitation is scope: the experiments focus on static indoor home-like environments, so broader indoor settings such as offices, restaurants, or construction sites remain open questions.
Comments